The Untracked Universe
The 8" Dobsonian telescope is a popular choice for stargazing for many reasons - it's simple, affordable, robust, reasonably portable, has excellent light gathering power, and is great for viewing both solar system and deep-sky objects.A question that commonly arises is whether it can also be used for astrophotography. Conventional wisdom says it's not up to the task because it can't automatically follow the movement of celestial objects as Earth rotates. In other words, it doesn't track. But the reality is that with a few small accessories and the most basic astro-camera (like the SVBony 105 used here), you can record your journey across the universe.As proof, here's every major type of celestial object imaged using by far the simplest and cheapest system capable of these results. The technique described at the bottom of this page. As far as I know, this is the first time many of these objects have been imaged in this way.The images are organized roughly by distance from Earth in a continuous scroll, allowing you to quickly get a sense of what's possible. Supporting information about each image is also provided to help you understand what you're seeing, and guide your own selection of targets.All the imaging was done from the Bellarine Peninsula, Australia (38°S) over a four year period, so there's a southern sky bias, though northern hemisphere targets rising no more than 10° above the horizon here have also been included.
Galaxies
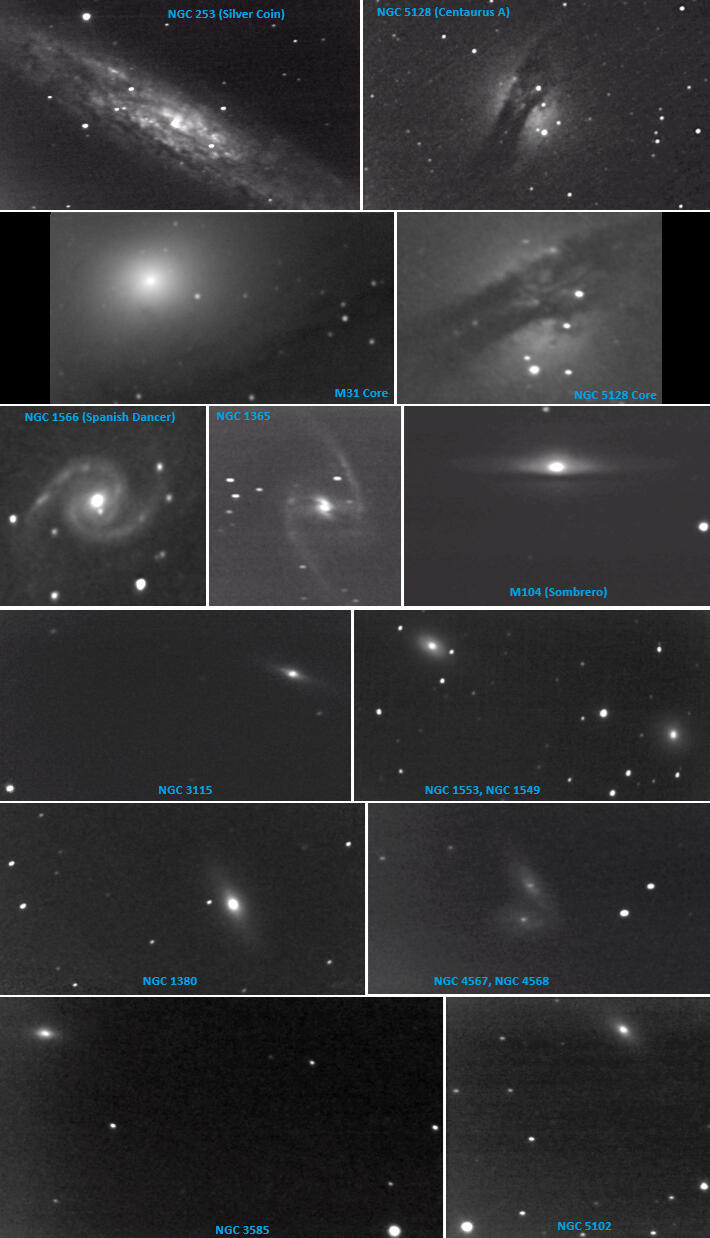
There's two main flavours of galaxy: spiral and non-spiral. The more face-on a spiral is, the more you see of its delicate arms, while edge-on it can look like an elongated spindle with a central bulge, like M104.Bright clumps, such as those in the arms of NGC 1566, often mark the sites of stellar nurseries. Dust within galaxies dims their light, creating dark lanes. NGC 253 for example, is one of the dustiest spiral galaxies, evident from the numerous dust lanes and rising columns of dust from the almost edge-on disk. NGC 1365 has dust lanes running along its central bar, extending into the nucleus and concealing it a little, and M104 shows a broad dust lane along its rim. In the image of M31 (Andromeda), you can make out parallel dust lanes running diagonally from the bottom of the image to the upper right, and dust clouds around the core. This galaxy is larger than our Milky Way and so close to us, that we're zoomed right into a small section of it here.
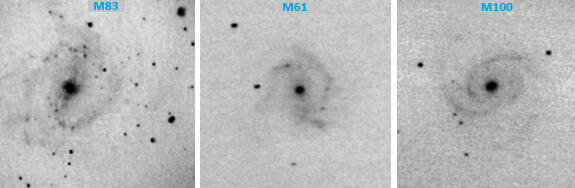
Spiral galaxies exhibit a wide range of structures, with variations in arm count, definition and shape. Even relatively short exposures can reveal the key differences - take these three galaxies, each captured under a couple of minutes of exposure. M83 and M61 are banded (or barred) spirals, whereas M100 features two tightly wound arms with faint extensions. M61’s arms show sharp directional changes, creating a polygonal shape. How galaxies can end up with straight arm sections remains an area of ongoing study. And it's clear from the image of M83 why William Lassell, who identified it as a spiral in 1862, described it as a 'three-brached spiral'.Non-spiral galaxies include elliptical galaxies like NGC 3585, which are spherical or oval, appearing the same from any angle. Lenticular galaxies, like NGC 1380 and NGC 3115, have the central bulge and disk of a spiral but lack the arms, giving them a lens shape.Many galaxies exist in gravitationally-bound clusters, providing opportunities to capture multiple galaxies in a single image, like NGC 1553 (lenticular) and NGC 1549 (elliptical). Gravitational interactions can cause galaxies to merge over time, as NGC 4567 and NGC 4568 are beginning to. The end result can be a new combined galaxy, like Centaurus A - an elliptical galaxy with a dust lane through the middle, thought to be the result of a merger between a large elliptical and a smaller spiral galaxy.
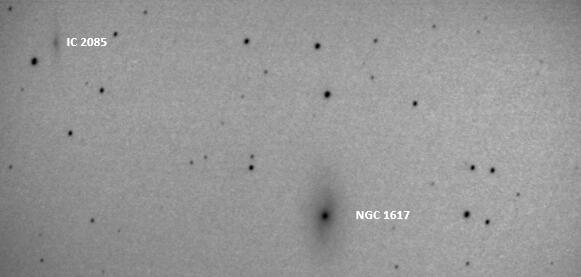
This image features a couple more members of the Dorado Group of galaxies - one of the richest in the southern hemisphere - lenticular IC 2085, and edge-on spiral NGC 1617. Due to the angle of view, the spiral arms of the latter appear compressed along the line of sight.
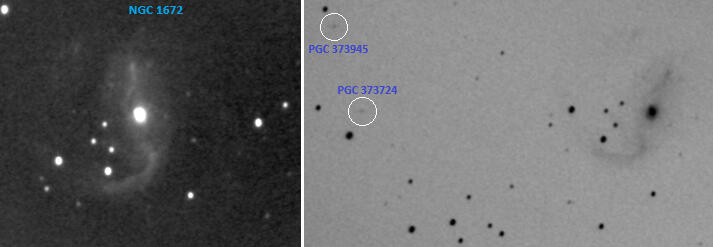
NGC 1672, a barred spiral galaxy, is a good example of one that's 'lopsided'. The left panel shows the arm extending leftward from the bottom of the bar to be quite a bit brighter than the one curving to the right from the top. The high surface brightness of the bar itself is courtesy of many stellar nurseries (starburst regions) along its length. Note also the thin, dark dust lanes swirling out from both the top and bottom of the nucleus, tracing the inner edges of the spiral arms.While imaging NGC 1672, I also happened to capture two distant galaxies in the same field of view (right panel) which I identified using Stellarium Web. These galaxies are listed in the PGC database, which catalogues small, faint objects - mostly galaxies - that can appear in the background of brighter, larger, more prominent Messier, NGC, or IC targets. So, how far are PGC 373724 and PGC 373945? For an estimate, we can consult the Glade 1 online catalogue, according to which they have a 'Dist' of 283.64 Mpc and 255.5 Mpc, respectively. Converting these measurements from megaparsecs to light-years, PGC 373724 is about 925 million light-years away, and PGC 373945 is estimated to be 833 million light-years distant!The Glade 1 catalogue compiles data from various astronomical resources (including HyperLEDA, a well known database focused on the physics and evolution of galaxies). It contains information on over 1.9 million galaxies, and is claimed complete for galaxies up to 73 Mpc distant, and more than half complete for those up to 300 Mpc.
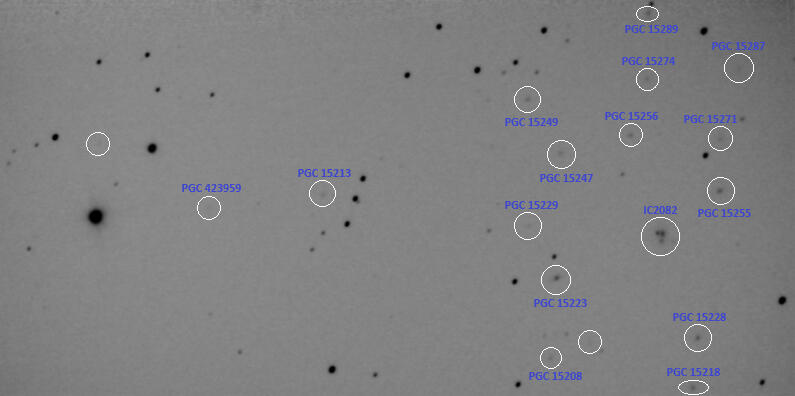
Incidental capture of small, distant galaxies aside, focusing on fields densely populated with PGC galaxies can be an awe-inspiring and rewarding pursuit in itself. Few other captures can convey the sheer scale and grandeur of the universe as seeing galaxies strewn about like confetti! Besides, it provides a great opportunity to test the resolution limits of your system.This particular field is located within three degrees of the third magnitude star Alpha Doradus. Using Stellarium, I identified 16 galaxies here, with a couple of others resolved but undesignated. These galaxies range in distance from 489 to 940 million light-years. Note the double nucleus of galaxy IC 2082, with its two components separated by just a few arcseconds.
You can't normally resolve individual stars in galaxies, you just see the fuzzy combined glow of them all. The stars in the images in this section are foreground ones in our own galaxy. There are however a couple of cases where you can observe a star in another galaxy:
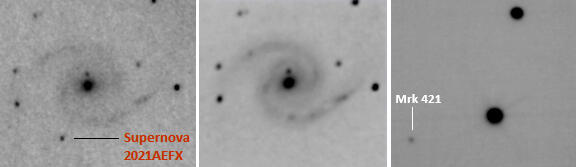
If a star goes supernova. One did just that in NGC 1566 in late 2021. When this white dwarf exploded, it was briefly billions of times brighter than the Sun. By the time the second image of the same galaxy was taken a year later, the explosion had well and truly faded from view.
If the galaxy is really close to us. All the galaxies in this section are millions of light-years away, but the Milky Way's closest satellite galaxies are 'only' tens of thousands of light-years distant, allowing us to distinguish individual stars within them. Examples appear in subsequent sections.
The right panel captures Markarian 421. This is a blazar, a type of quasar with a 'relativistic jet' from its core pointed directly at Earth. Quasars are galaxies with bright cores powered by supermassive black holes, and relativistic jets are ultra high-speed streams of charged particles expelled from the black hole’s vicinity. This is one of the closest such objects to Earth - Glade 1 says 'Mrk 421' is 133.66 Mpc, or about 435 million light-years away.
Emission Nebulae
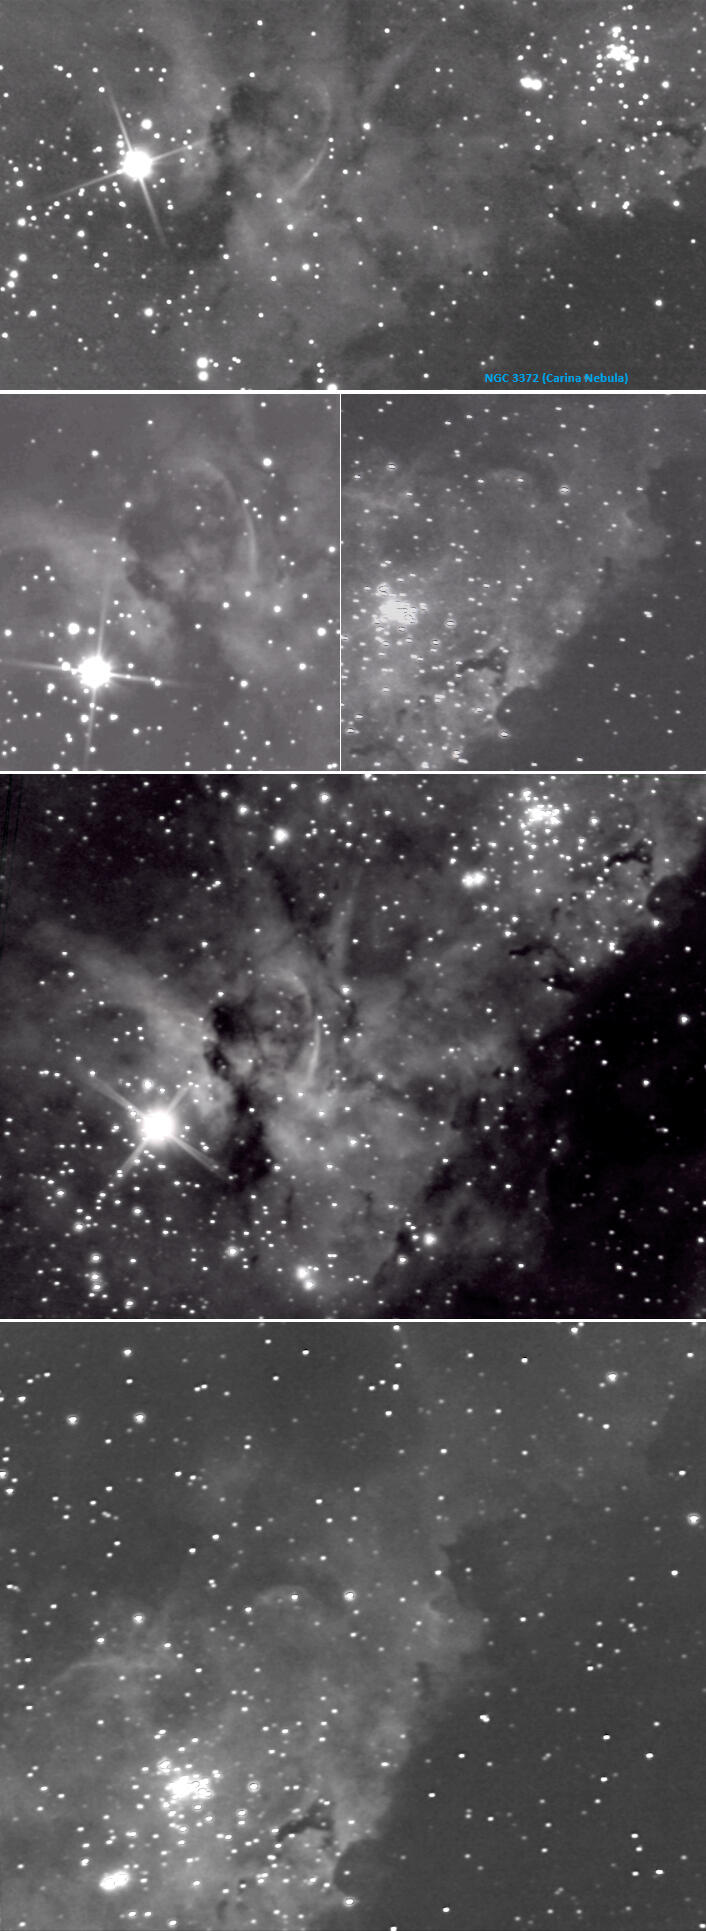
The Carina nebula is one of the largest and brightest in the sky, an evolving cloud of interstellar gas and dust. In the top panel we're at the business end of it, witnessing stellar birth and death in the one image. The left side of the image features a nebula within the nebula - the Keyhole - so called because, well, it kind of looks like one. It's shaped both by the bright fluorescence of gas ionized by young stars within it, and the darker dust plumes which obscure the light. The dust plumes were likely blown in by the radiation from Eta Carinae to its left - a massive, highly unstable star nearing its end. In contrast, the top right corner of the image is dominated by Trumpler 14, one of the youngest and most active star-forming regions in the Milky Way. The stars in this cluster are not even a million years old, yet they're burning through the available hydrogen at a phenomenal rate. They're living fast and will die young - probably in only the next few million years - and when they do, they'll go out with a bang.Between the Trumpler 14 cluster and the diagonal dark dust band running along the lower right of the image, some isolated gas and dust 'pillars' are visible. These conceal protostars - embryo stars which are still gathering mass from the surrounding material and haven't begun fusion yet. But their gravitational pull is enough to prevent the winds and radiation from Trumpler 14 from blowing out the 'pillars'.The next two panels focus separately on the Keyhole nebula, and the region of the Carina nebula to the north-east of Trumpler 14. In the bottom two panels, the cumulative exposure is doubled to about one minute.
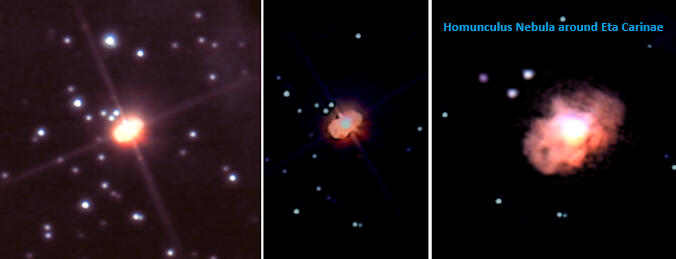
Backing off the exposure on Eta Carinae reveals not the star itself, but another nebula enveloping it called Homunculus, a light-year long gas and dust cloud ejected from Eta Carinae.In 1843 Eta Carinae went from being an unremarkable fourth magnitude star to one almost as bright as Sirius, despite being a thousand times further. This was a supernova-level outburst but amazingly, it didn't destroy the star, so it's called a 'supernova imposter'. The explosion produced a cloud of debris shaped like an hourglass, with two polar lobes and a thin equatorial disk, which we now see as the Homunculus nebula. The image in the right panel was taken with 3x Barlow lens and best shows its detail, including the overall puffiness and fluffiness of the gas and dust clouds. The Homunculus is mainly a reflection nebula, and the dustiness of the lobes results in mostly red light leaking out.
Being less than a couple of centuries old, the Homunculus Nebula is an infant in astronomical terms, but is also one of the very few deep sky objects you can actually see change over time. The lobes of gas and dust are expanding at up to two million kilometres per hour, and dust in front of Eta Carinae is dissipating, increasing the brightness of the star - it's expected that by 2036, it will have become bright enough to overwhelm visibility of Homunculus itself. Here's a blink showing changes between two images I took of the nebula - in May 2021, and March 2025.
The next nebula needs no introduction. It's one of the most scrutinized and imaged objects in the night sky, and at less than 1,500 light-years away, is the closest major star forming region to Earth.
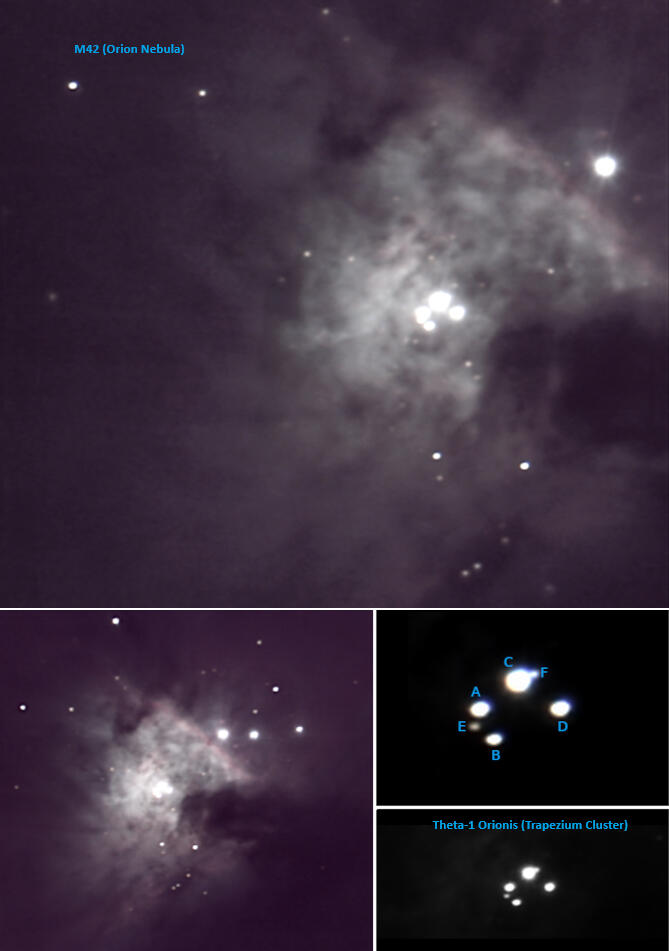
The Orion nebula's surface brightness is legendary, and here our imaging system gets right into its blazing core. The image in the top panel is at native focal length, and the smaller one made with a 0.5x reducer. The dust cloud of the 'Fish's mouth' rests along the centre of the right edge of the large image. To its left is the young hot 'Trapezium' star cluster forming from the gas and dust of the nebula, which in turn is bombarding the nebula with UV radiation causing the famed crimson fluorescent glow. The six main stars of the Trapezium A-F are clearly resolved.
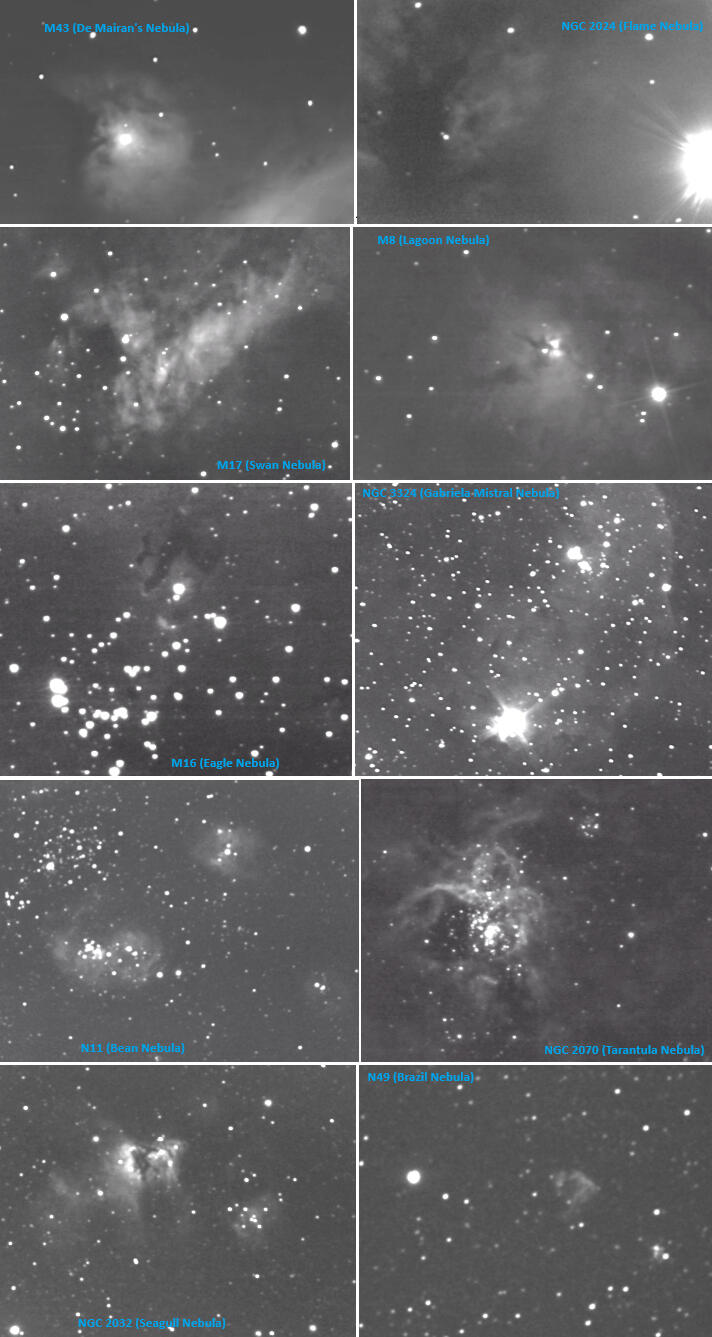
The top three rows of images in this set present some well known nebulae (the Gabriela Mistral nebula perhaps less so, as it's a southern sky object). Our imaging system delves into the cores of these nebulae, allowing their structures to be studied. For example, a striking amoeba-like dark nebulosity is seen at the heart of the Lagoon nebula (except at a couple of light-years across, it's a tad larger than an amoeba), which surrounds the star Herschel 36, located at the centre of the image. This star lights up the brightest part of the nebula - the 'bow-tie' or 'hourglass' to its right. The intense ionizing radiation from both Herschel 36 and other nearby stars, generates powerful stellar winds which sculpt the nebulosity into flowing streamers and curtains of gas and dust.While widefield, long-exposure images of emission nebulae are more common, they typically show smaller, overexposed cores, while capturing more of the surrounding nebulosity.The dim Flame nebula, shaped by nearby supergiant, super bright star Alnitak, was the most challenging to image in the set.The bottom two rows of images show nebulae located in another galaxy - the Large Magellanic Cloud. The Brazil nebula is a supernova remnant, one of the brightest such objects in the LMC.
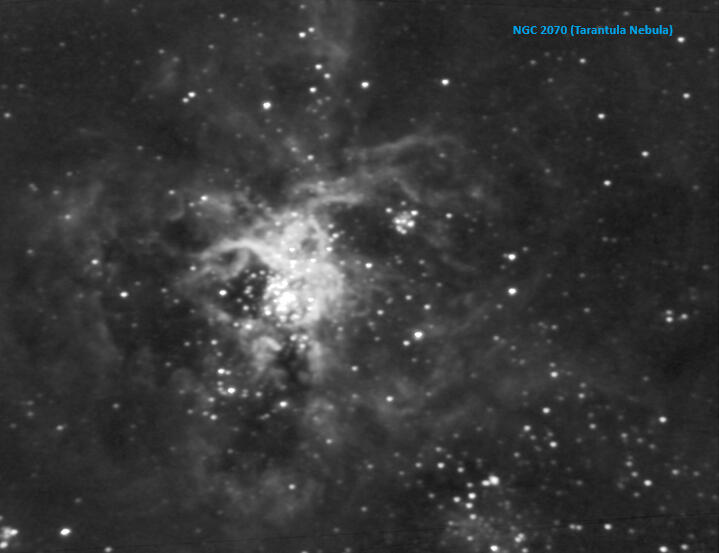
It's clear from this wider view of the Tarantula Nebula's spider-like strands of glowing gas, as to why it's called that. The star cluster at the centre - R136 - is home to the hottest, most massive stars known, and is the largest and brightest star-forming region in all the galaxies nearest our Milky Way. If the Tarantula were at the same distance as the Orion Nebula rather than being more than a hundred times further away in another galaxy, it would stretch almost half way across the sky and would be bright enough to cast shadows.
Planetary Nebulae
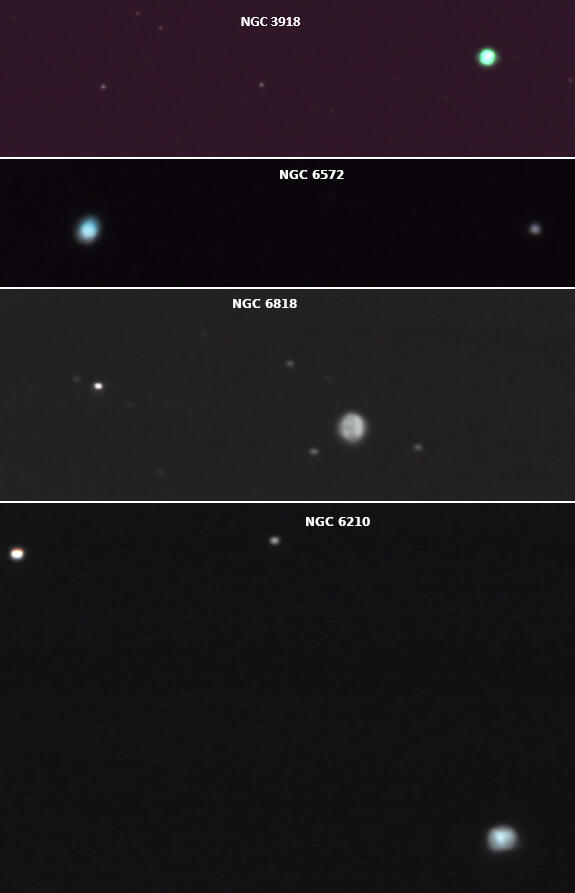
Planetary nebulae have nothing to do with planets. They're so called because some looked like planets to early observers - compact and consistently bright, with well defined round or oval outlines, like these ones.
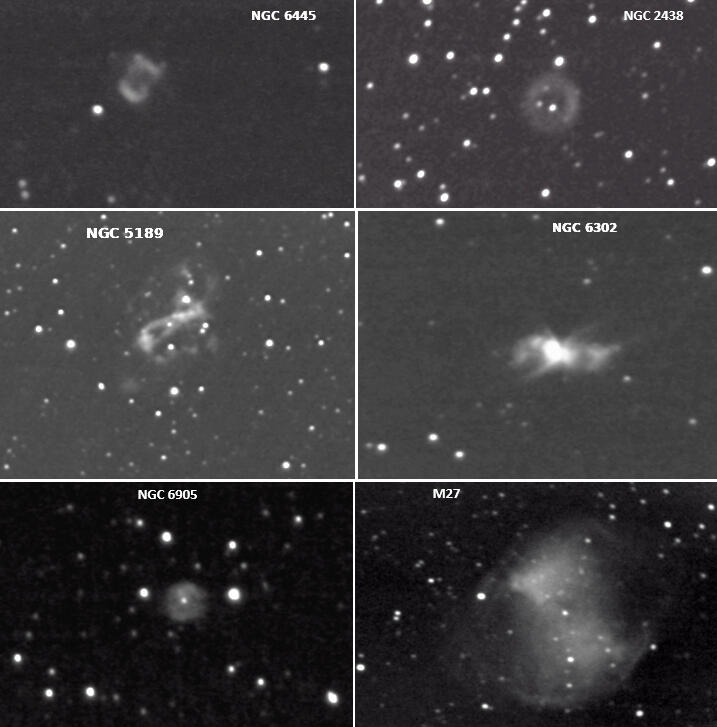
But there's plenty of planetary nebulae that look nothing like planets, such as the ones in this set. Planetary nebulae are actually a type of emission nebula formed when a star with a mass up to eight times that of the Sun runs out of fuel at the end of its life. At that stage the star blows off its outer shells and begins to lose mass. This allows the hot, inner core of the star (collapsing from a red giant to a white dwarf) to radiate strongly, causing the outward-moving cocoon of gas to glow brightly. Around 1,500 planetary nebuale are known to exist in the Milky Way, and they last no more than a few tens of thousands of years, by which time the expanding gas shells have thinned out so much that they're no longer visible.
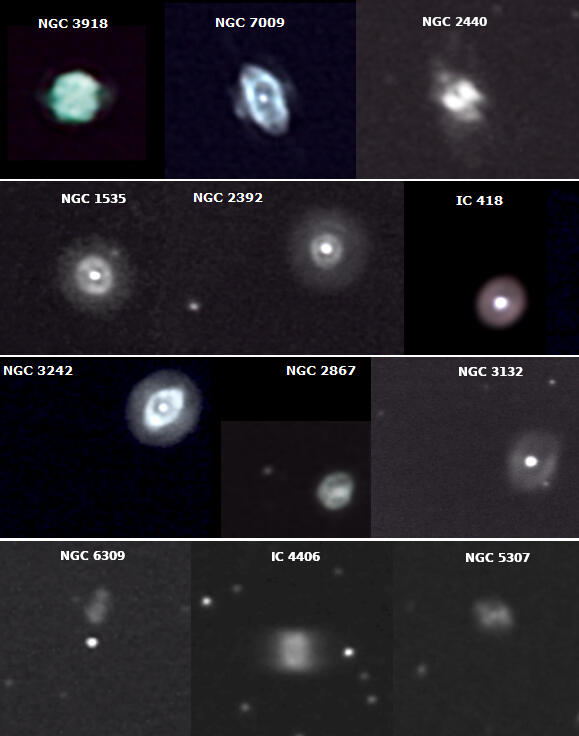
You'd expect the expelled shells of gas to move out more or less spherically and symmetrically, and as this set shows, they do indeed in some cases. But the butterfly, eye-like, spiral and other intricate shapes some planetary nebulae exhibit are possibly due to the interaction of stellar winds, magnetic fields, asymmetries in the star's mass loss, and even whether or not the star was part of a binary or multiple star system.The planetary nebulae here cover a wide range of surface brightness and apparent size - from eight arcminutes in the case of M27, to about 15 arcseconds for NGC 6309 and NGC 5307.
Globular Star Clusters
Star clusters are groups of stars that have formed around the same time from the same nebula, held together by gravity. They can be either open or globular. The latter are tightly bound and spherical-shaped, and differ from open clusters in a few other ways:
Globular clusters are very old, open clusters are young.
Globular clusters are not normally associated with interstellar matter (gas and dust), but open clusters can be.
Globular clusters are found in the dome-like 'halo' around galaxies, while open clusters are situated close to the galactic plane.
Globular clusters have a lot more stars than open clusters.
The density of stars towards the nucleus of a globular cluster is a lot higher than that of open clusters.
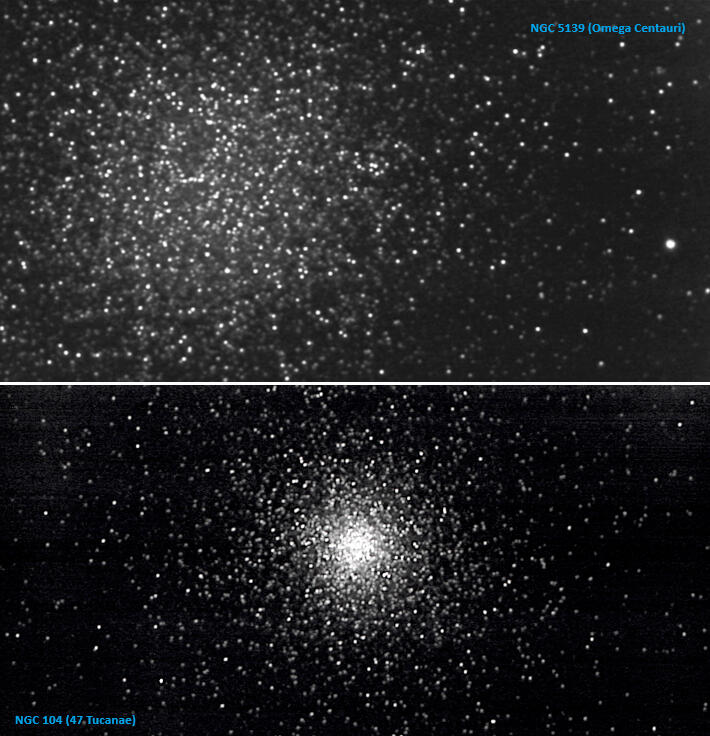
There's about 150 globular clusters around the Milky Way, with many containing hundreds of thousands of stars. Two however, are exceptional - our galaxy's largest and brightest globulars - Omega Centauri contains about 10 million stars, and 47 Tucanae upwards of a million. It's speculated they could even be the remnant cores of dwarf galaxies whose outer stars were stripped away through gravitational interaction with the Milky Way.
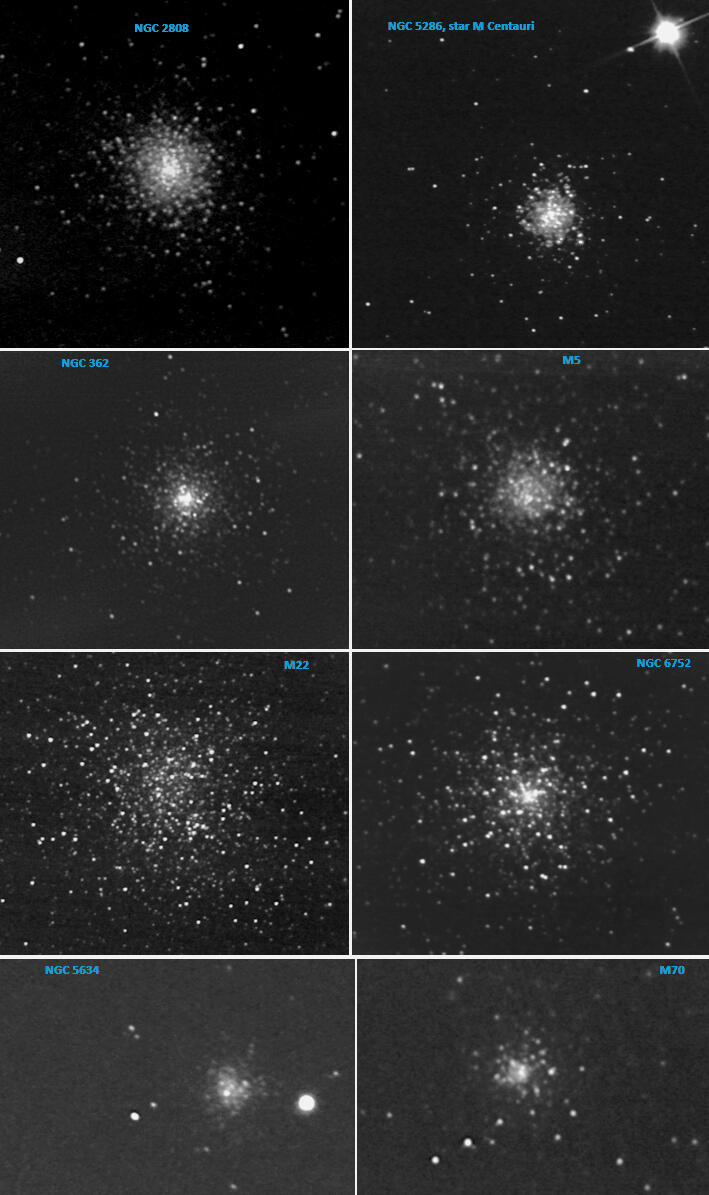
The globulars in this set of images are more 'typical', spanning a range of diameters, magnitudes and stellar concentrations. Their distance varies from about 10,000 light-years for M22 to 80,000 light-years away for NGC 5634. Dark 'lanes' and shapes through some of these are probably regions of lower stellar density, dimmer stars, or both.
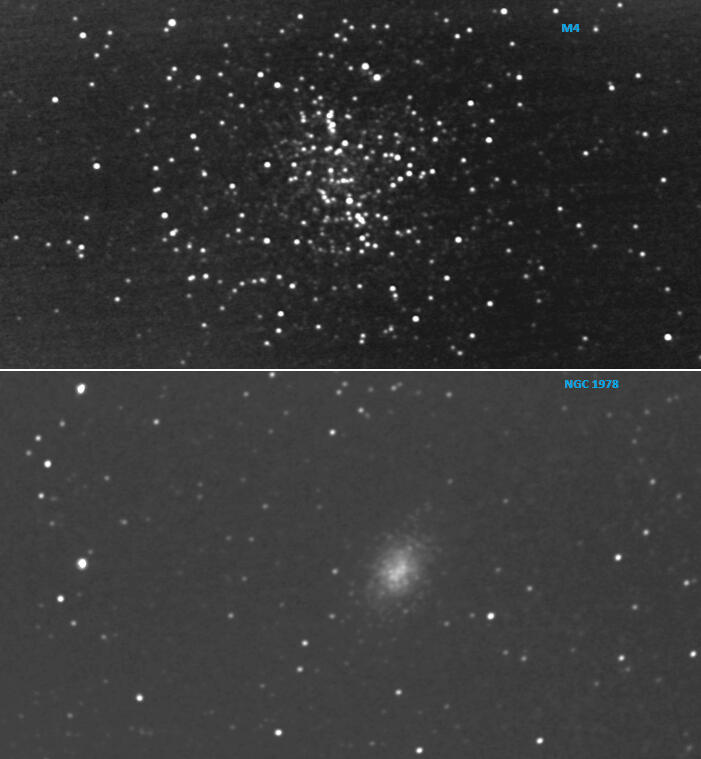
M4 is the closest globular cluster to us, at about 6,000 light-years away, the first to be resolved into individual stars, and it has an unusually loose structure, looking almost like an open cluster, with a distinctive 'bar' of stars stretching across its centre. Conversely, NGC 1978 is the furthest globular cluster on this site, located in the LMC galaxy, 160,000 light-years from us. It's also one of the most elliptical clusters known, which could be the result of a merger between two clusters, or gravitational interaction between the cluster and LMC.
Open Star Clusters
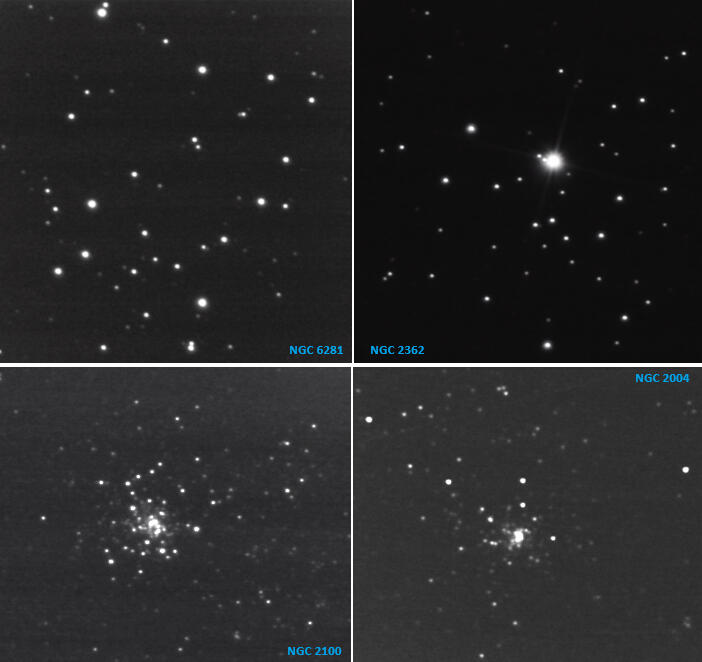
There's at least ten times more open clusters than globular clusters in our galaxy, so you're spoilt for imaging choice. A couple that I quite like are NGC 6281, whose main stars are arranged in a pyramid shape, and it also features many pairs of stars, and NGC 2362, where a fourth magnitude star - Tau Canis Majoris - forms the centre around which other tenth to twelveth magnitude stars are clustered.The other two open cluster examples in this set - NGC 2004 and NGC 2100 - are both located in the LMC. On the one hand, despite being in another galaxy, some of their individual stars can be resolved. On the other hand, the clusters' cores appear similar to globular clusters due to the distance, even though they are far less tightly bound than globular clusters.
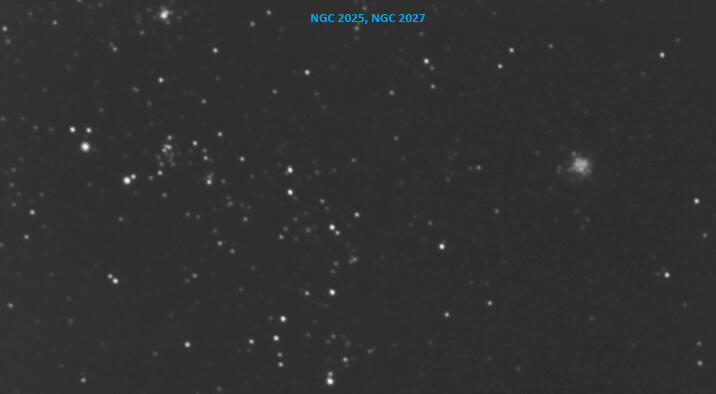
A couple more highly contrasting open clusters in the same field of view, again in the LMC. During his surveys with an 18" telescope in the nineteenth century, John Herschel described NGC 2027 on the left as 'a very large and fine cluster...of all degrees of condensation, and much broken up into groups and patches', and NGC 2025 on the right as 'slightly elongated...resolvable. Almost a globular cluster'.
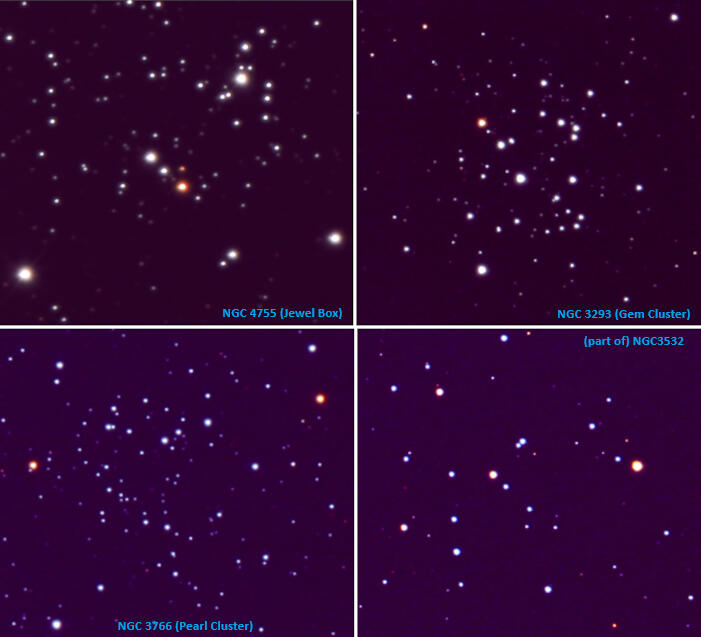
Jewel box, gem cluster...you don't have to strain your imagination too much to liken a group of stars to a sparkling bunch of precious stones. But which cluster best fits the analogy?First up we have the iconic 'Jewel Box' (NGC4755), near Mimosa of the Southern Cross. As far as colour mix goes, amongst the whites there's the magnificent orange DU Crucis - one of three equally spaced stars also called the 'traffic lights' - and a smaller (dimmer) orange star to their side.The 'Gem Cluster' (NGC 3293) has a similar pattern of three equally spaced stars, one orange, just like the Jewel Box. There's another small orange star in the top left of the cluster, but overall, no advance on the Jewel Box's 'one and a half rubies amongst all diamonds'.Moving on to the 'Pearl Cluster' NGC3766. OK, pearls aren't stones, but I suppose they're still considered gems. The striking star pattern of this one is flanked by two red giants. So we've upped the colour quotient here. Can we do better?How about for kicks, we check out part of the 'Football Cluster' NGC 3532 (ahem). Now we're talking! Behold a wonderful balanced distribution of whites and reds. Besides the four red giants, there's a few smaller, even redder ones dispersed throughout the group. This cluster goes by a few other names as well, like 'Firefly Party', 'Wishing Well' and 'Pincushion'. None of those allude to gems or jewels, but ironically for my money, this one comes closest to the mental image I have of a glittering, colourful casket of valuable crystals.
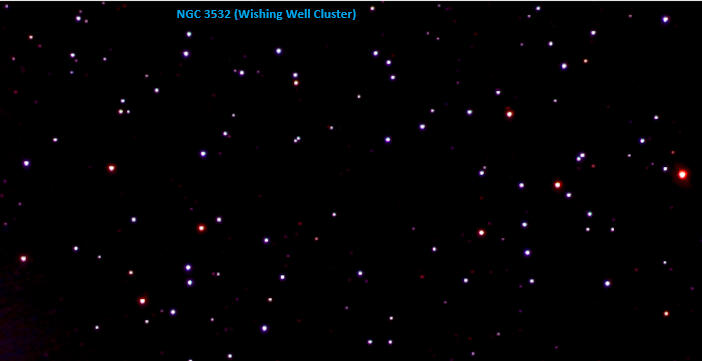
NGC 3532 consists of a few hundered stars, and just its core covers more than 30 arcminutes, but with a 0.5x reducer, we can fit most of it in one image, as here.Even though the members of star clusters usually have similar composition because they came from the same cloud, the mass of each star can differ. The more massive ones go through their life cycle more quickly, which means they reach the red giant stage sooner than the others. Which is why there can be a mix of luminosities and colours in a cluster, ranging anywhere from blue-white through yellow (like our Sun), orange and red. Our eyesight isn't really suited for picking out colours in the dark, but with imaging we can capture the contrasting star colours nicely.
Colourful Stars
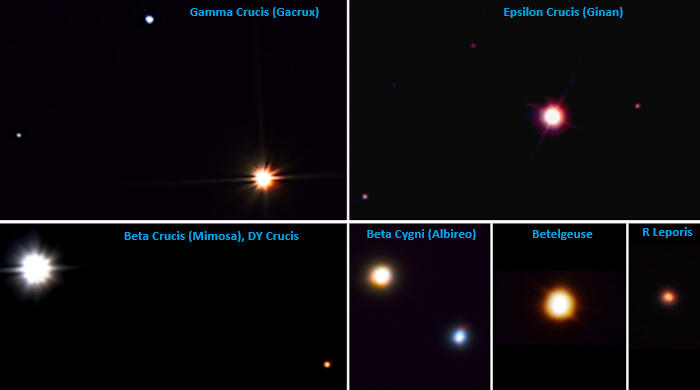
Most stars are born in clusters, and usually have many siblings. Over time however, like members of a family, they can end up scattered everywhere, even alone. For example, the nearest star to our Sun, just four light-years away, is not its sibling; that would be HD 162826, 110 light-years away. Lone stars can still be of any colour, because their life cycle is determined by their mass, regardless of whether they're still part of a cluster.Two of the Southern Cross' five independent stars are red - Gacrux, the 'top' of the cross, is the closest red giant to Earth, and Ginan, the cross' 'fifth star', is a red supergiant - it's larger and more luminous than Gacrux, but looks dimmer from Earth as it's much further away.DY Crucis (near Mimosa, the second brightest star of the Southern Cross) and R Leporis, are Carbon stars. The high level of carbon molecules in their atmosphere absorb the shorter light wavelengths (violet, blue and green), which can make them look especially red. Carbon stars are also variable, meaning their brightness can change by many magnitudes over the course of months or years, and they tend to be reddest when they are the dimmest in their cycle.Albireo is a popular optical double - two stars that appear to be close together in the sky because of how they're aligned from our perspective, but really aren't. Its two components have strongly contrasting colours – one red and the other blue.Betelgeuse would have to be one of the most well-known red supergiant stars. It has expanded to about 1,000 times the Sun’s radius, and is expected to supernova 'any day now'.
Multiple Star Systems
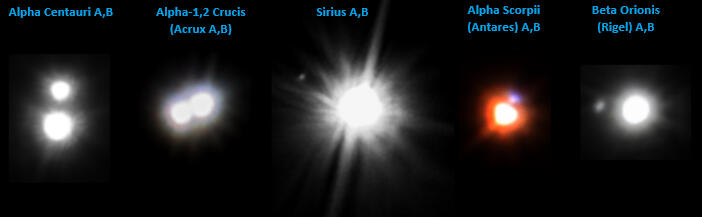
Visual double stars can of course be true binaries - stars that are gravitationally bound, and orbit each other. In fact the vast majority of stars are thought to exist in systems with two or three stars, and most of those are thought to have been born that way, from the same cloud, rather than created through gravitational capture between lone stars. There can be a huge difference in size, mass and brightness between the component stars. Similarly, the distances between the components and their orbital period, can also vary greatly from one binary to another.For imaging, we're interested in binaries that are sufficiently separated to 'split' them, and with our imaging system, we're able to resolve down to an arcsecond of angular separation. For example, the red supergiant Antares and its companion 'regular' (main sequence) star are about 2.6 arcseconds apart, and since their orbital period is at least many hundreds of years, that separation doesn't change much from year to year. On the other hand, Alpha Centauri A and B, the nearest Sun-like stars to the solar system, orbit each other with a period of 80 years, during which time their separation varies between 2 and 22 arcseconds, so the ease of splitting them can vary over a lifetime of imaging.It's a similar situation with Sirius and its companion 'the Pup' - their separation varies between 3 and 11 arcseconds over 50 years. However, splitting them comes with the additional challenge that main sequence Sirius, the brightest star in the sky, is 10,000 times brighter than the Pup, a white dwarf smaller than Earth, so it's easily swamped in the glare.
Jupiter
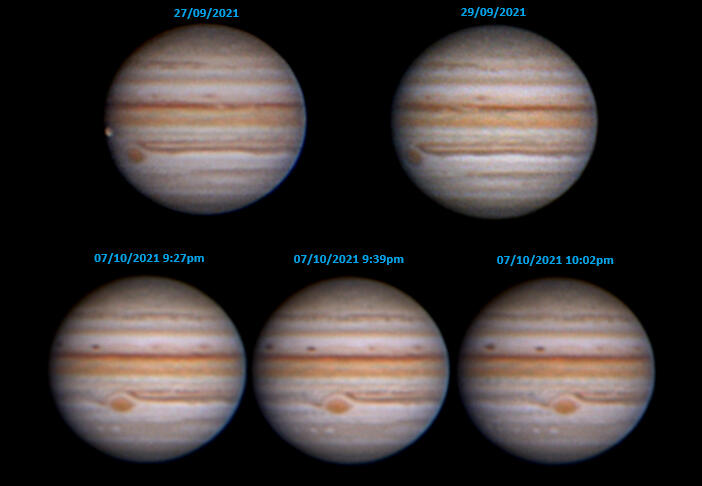
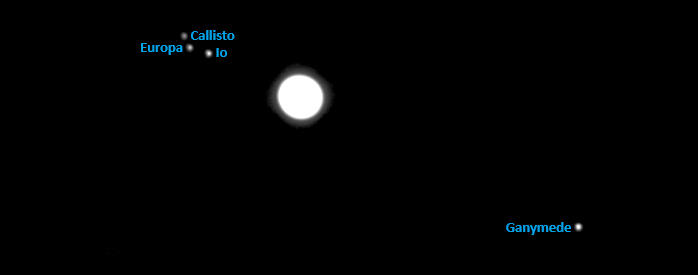
Our imaging system makes a serious study of Jupiter possible. You get a large, bright disk, with good resolution of all its belts and zones, the Great Red Spot (GRS), and a multitude of other small scale atmoshperic featues like brown barges, festoons and ovals. Jupiter's appearance is always changing across all timescales - from minutes to years.Within minutes, you can see the planet rotating - it spins once in just under ten hours, the fastest of any planet in the solar system - and often, one or more of its four great moons pass in front of it and cast shadows on its clouds. Over days and weeks, you can see its weather systems evolve, and over years, you can see dramatic changes in its appearance, including disappearance and re-appearance of belts and zones, and changes in their colour, width and structure.Only two days separate the top two images in this set, yet some changes along the North Equatorial Belt (the darkest band across the planet) can be seen. The GRS is rising at the left limb, and in the first image Ganymede, the largest of Jupiter's moons, is also about to transit - you can just make out some surface detail on it.Thirty minutes separate the three images in the next row, and in this time the change in position of the GRS makes the planet's rotation quite apparent. Also in the first of these images, we see three equally spaced brown barges (long dark ovals) at the top of the NEB, but by the third image, four have rotated into view. Similarly, in the first image there's a procession of three white ovals in the South Temperate region, but by the third image, five have become visible.
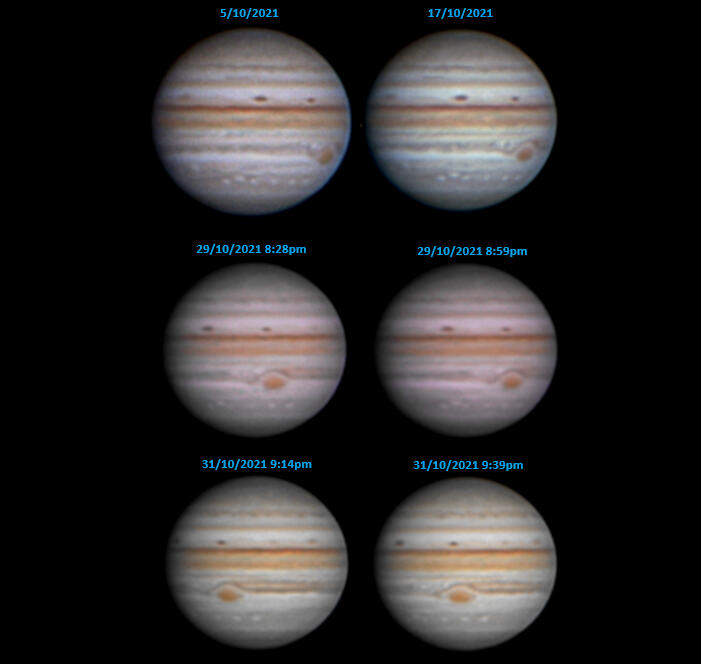
Here's another three sets of Jupiter images for comparing changes that have occurred over periods ranging from 25 minutes, to 12 days.
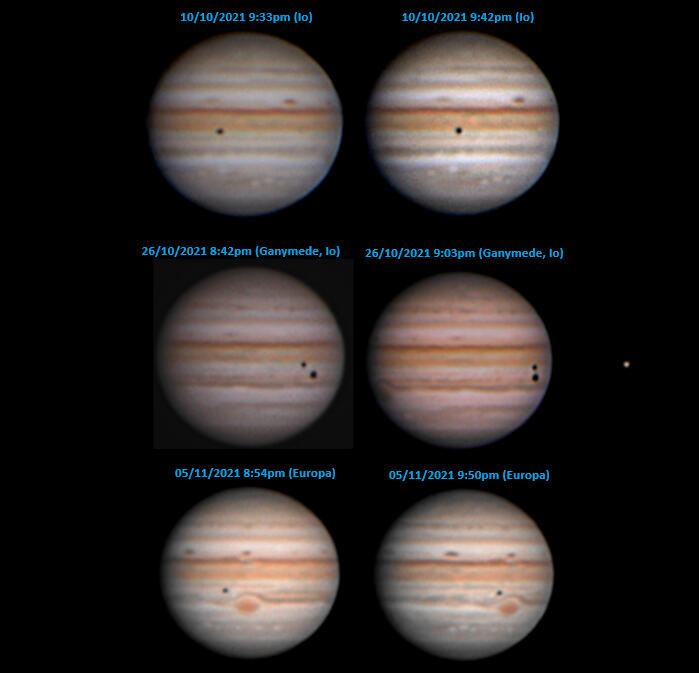
This set of images records shadow transits of three of Jupiter's four Galilean moons across its disk. The shadows are high contrast against the cloud tops, so they really stand out, unlike the moons themselves, which can be difficult to see against the planet when transiting. The shadows are representative of the size of the moons, so it's clear that Europa is the smallest of the three and Ganymede the largest. You should easily be able to catch a shadow transit every week. Double transits are a lot less common - perhaps a couple of opportunities every couple of months, and triple transits a lot less common still - once in a few years, and sometimes decades. The last one occurred in 2015, and the next will be in 2032.Io, Europa, and Ganymede are in a 1:2:4 orbital resonance, meaning for every orbit of Ganymede, Europa completes two orbits, and Io four. As a result, only two of these three innermost moons can cross Jupiter's disk at the same time, but never all three together. So a triple shadow transit must always include the outermost moon, Callisto. But Callisto’s slightly inclined orbit means it doesn’t always cast a shadow on Jupiter, making triple shadow transits rare. This also explains why we'll never be treated to a quadruple shadow transit.
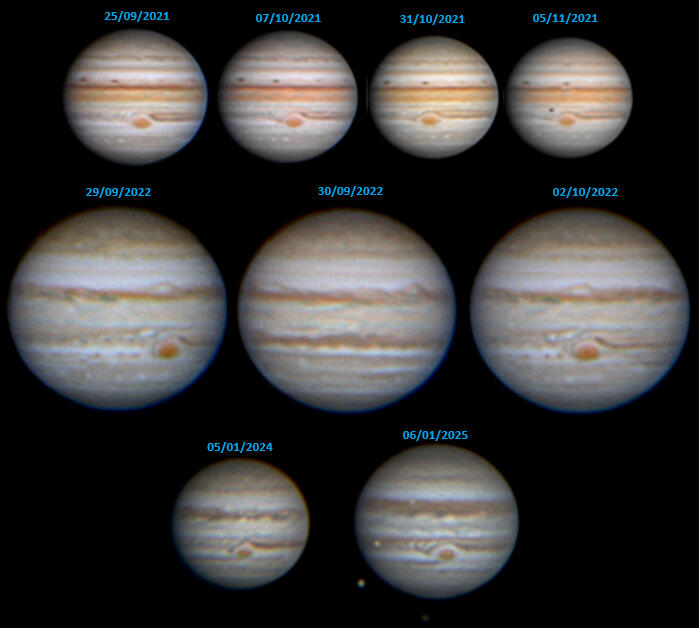
Jupiter's atmospheric circulation is driven by powerful jet streams that move in varying directions and speeds, evident in the first row of images centred on the GRS. Over six weeks, the relative positions of the brown barges, white ovals, and GRS shift noticeably.The second row shows changes over a year: the Equatorial Zone's deep orange hue has faded, the NEB is less defined, and the brown barges have gone. New vortices have appeared along the NEB’s top edge, and the North Temperate Belt is less distinct. Blue projections and festoons from the southern NEB extend into the EZ, a curved bridge from the South Equatorial Belt to the underside of the GRS has appeared, and storm outbreaks are visible in the GRS' wake. Jupiter is larger in these 2022 images because they were taken close to Opposition, when the planet reached 49.9 arcseconds in apparent size - the largest in 70 years.The third row images were taken with a Zwo 533MC camera and 2x Barlow lens (scroll to end of page for more details about planetary imaging), so the image scale is smaller. However, I've included them to illustrate the change in Jupiter's appearance over a period of years:Overall, the most dramatic changes occurred between 2021 and 2022 (as described above).From 2022 to 2024, the SEB-GRS bridge weakened, the NTB became even less distinct, and the brown ovals in the South Tropical Zone to the west of GRS disappeared.Between 2024 and 2025, the top edge of the SEB darkened, bands of material pulled from the NEB in the wake of the GRS became visible, the EZ darkened, and the NEB became more distinct, with consistent width and colour.Over the three years of these images, the GRS has shrunk and become rounder. It’s unclear if it will continue shrinking or stabilize at a smaller size, potentially due to fewer storms feeding it, or other atmospheric changes draining its energy.
It's fascinating watching the celestial ballet of Jupiter and its moons play out. The moons shift positions, cluster, spread apart, and align in various configurations. Sometimes, there's a look-alike star in the mix just to confuse matters. Not all four moons are always visible - sometimes one is hidden behind Jupiter, or temporarily eclipsed by the planet’s shadow. And every six years, Earth crosses the same orbital plane as Jupiter’s moons, which can cause one moon to momentarily occult another.
Saturn
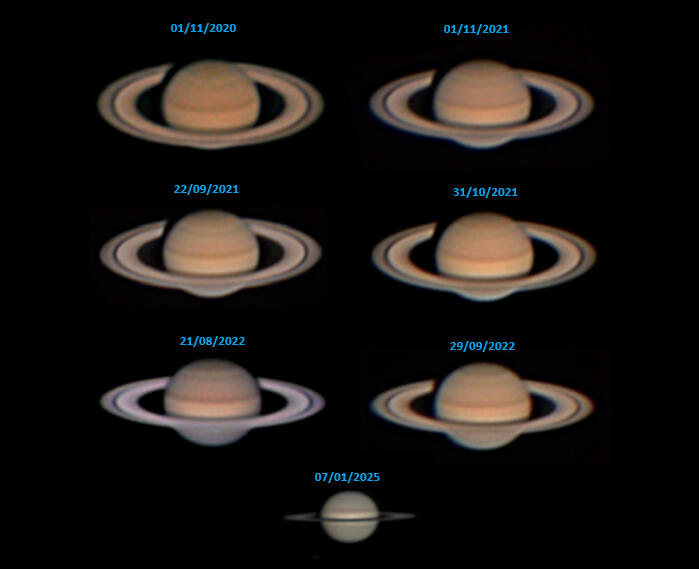
For many people, seeing Saturn and its rings for the first time through an eyepiece is a defining moment. And of course it's a great planet to image. You can clearly make out its belts and zones, but they're lower contrast, and sport fewer features, than those of Jupiter, and so changes are harder to detect. Occasionally though, white storm outbreaks can show up well.Here you can see that each year from 2020 to 2022, Saturn's rings are progressively less 'open'. About every 15 years, the rings virtually disappear as they're presented edgewise when Earth and the Sun pass through the plane of the rings. At this time Saturn offers a preview of what’s to come in the distant future, when it will actually lose its rings due to the combined effects of the Sun's radiation, and the planet's magnetic field and gravity.The last image from 07/01/2025, taken with a Zwo 533MC camera and 2x Barlow lens, has a smaller image scale but shows the rings almost edge-on.Notice the dark shadow strip along the planet's disk, cast from Saturn's rings. Also notice at the top left of almost every image, the shadow cast by the planet itself onto the rings, making it look as if there's a 'break' in the rings. The one exception to this is the 21/08/2022 image, as this was taken within a week of the planet's Opposition. Since at this time Saturn is directly in line with Earth and Sun, its shadow falls behind it, revealing more of its ring surface. This, together with the fact that the particles that make up the rings cast no shadows, makes the rings shine more brightly than usual (called the Seeliger Effect), which is really noticeable when you compare this image with the one a few weeks later.
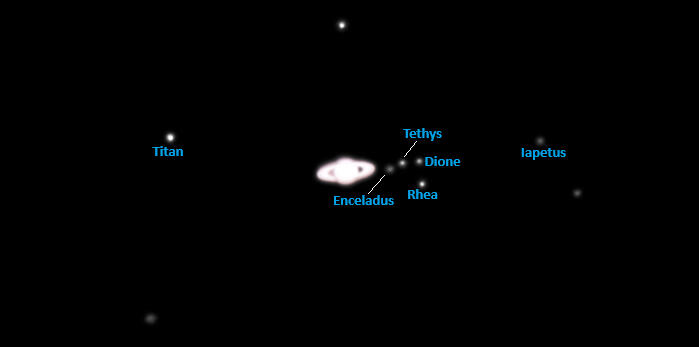
At last count, Saturn has more moons than all the rest of the planets in the solar system combined. So how many of Saturn's moons can our imaging system record? In this image, there's six. Titan is almost the same size as Jupiter's largest moon Ganymede (both are bigger than Mercury), but the largest of Saturn's others is no more than half the diameter of the smallest of Jupiter's four Galilean moons. The smallest moon in the image is Enceladus, with a diameter of about 500 km.You should theoretically be able to capture a couple more moons. Mimas is smaller than Enceladus, but the main issue with it is that it orbits closest to Saturn, and is easily lost in the glare of its rings. The best time to image it would be when the rings aren't as 'open', and Mimas is furthest from the planet in its orbit. Hyperion, though the largest of Saturn's irregularly shaped moons, is even smaller than Mimas, and as it chaotically tumbles along its highly eccentric orbit between Titan and Iapetus, capturing it would be pushing the limits of resolution.It's also worth noting that Iapetus is 'two faced' - one hemisphere is much brighter than the other, and that hemisphere faces us when Iapetus is on one side of Saturn in its orbit, where it's brighter by three magnitudes than when the moon is on the other side of Saturn.
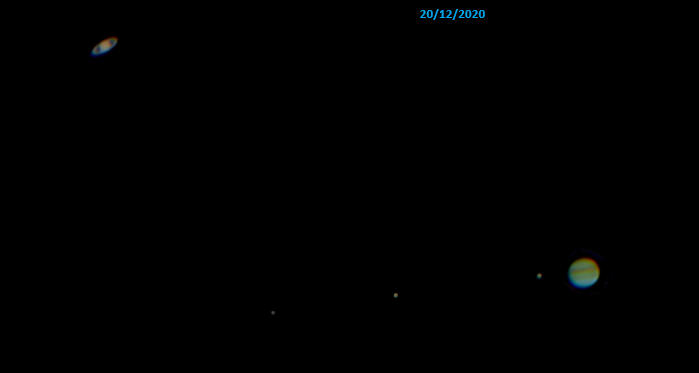
So-called 'great conjunctions' happen every 20 years. 'Great' because they involve the solar system's greatest planets - Jupiter and Saturn. This is when from our pespective, they appear closest in the sky, which in most cases is within 1° of each other. The 2020 one was extra special as they came within 0.1° (six arcminutes) of each other. The last time they were that close, and visible, was in 1226 C.E. This image was taken one day before 'conjuction day', when the great ones were separated by about eight arcminutes. Unfortunately the next day was clouded over at my location.
Mars
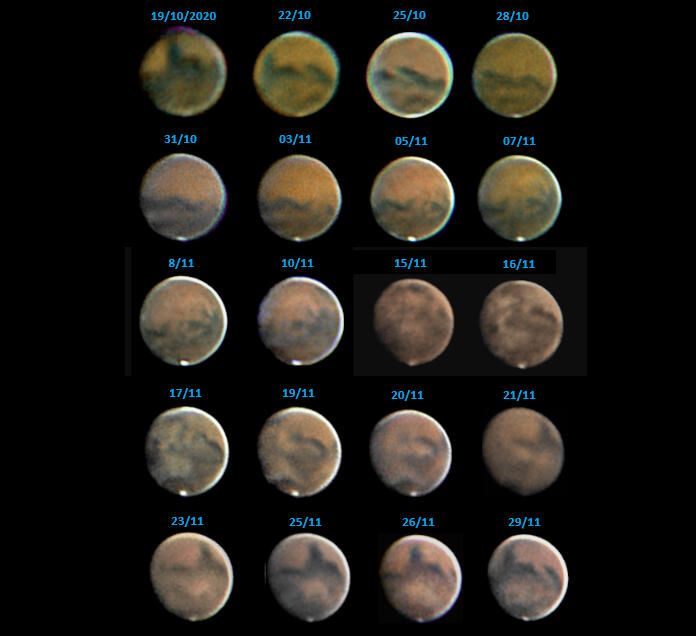
If you want to know what it's like to observe Earth from another planet, swing your 'scope to Mars. OK, so it's not exactly blue, and you'll have a hard time spotting any oceans but hey, that's just minor details...you still get to see surface features, seasonal changes in polar ice caps, and atmospheric activity like clouds, haze and dust storms.Mars' apparent size can vary considerably, so the best time to image it is a few weeks either side of Opposition, when it's closest to Earth and its disk fully illuminated. This set of images was taken around the time of the 2020 Opposition, when Mars reached just over 22 arcseconds in apparent size. The images span 40 days to record one full 'rotation' of the planet: Mars and Earth both spin on their axes in the same direction, but Mars takes 24.6 hours to complete one rotation, compared to Earth's 24 hours. This means each night you view Mars, you see a bit 'further along' it - so it appears to be slowly rotating clockwise, and it takes about 40 days to see all the way around it.Martian surface details show up as 'albedo features' - contrasting areas of light and dark. These don't necessarily correspond with geological features like mountains, craters and canyons, but sometimes they do. For example the set of images start and finish at the darkest albedo feature on Mars - the 'L' shaped Syrtis Major against the left limb of the planet, an elevated plateau covered with lava that erupted from a low shield volcano. The light-coloured circular feature to its south is Hellas - one of the largest impact basins in the solar system. Solis Laucs - the 'Eye of Mars' - is looking back at you in the image of 08/11/2020. Valles Marineris — the largest canyon system in the solar system - forms the northern rim of the 'Eye'.
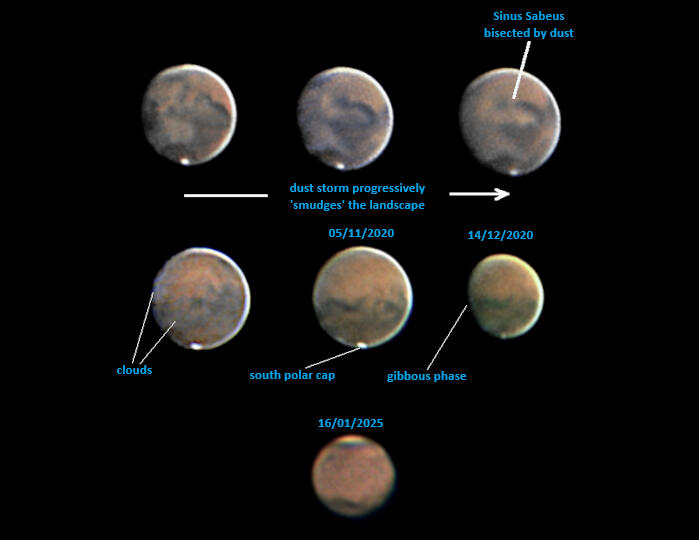
At the start of the 'virtual rotation' sequence, Mars displays a full disk, but towards the end, part of its left limb is shadowed. As the last row of this set of images shows, by the following month even more of the planet is shadowed and its apparent size has reduced quite a bit. That's because by then we've moved away from Opposition and towards 'Eastern Quadrature', as a result of Earth continuing to charge ahead in its orbit and Mars falling behind. Quadrature is when the lines of sight from the Sun to Earth and from Earth to Mars form a right angle, in other words, when Mars is directly east or west of Earth.The south polar ice cap can be seen to shrink as the sequence progresses, because the southern Martian hemisphere was experiencing summer during the imaging period. Also, dust storms occur frequently on Mars. Their presence reduces the contrast, changes the colour or 'washes out' albedo features, and the less common global dust storms - like the one in 2018 which knocked out the Opportunity rover - can even block the view of the surface entirely.
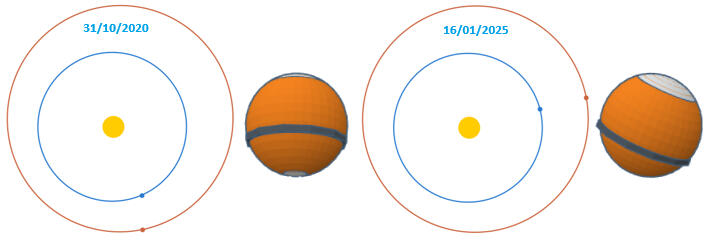
Mars' apparent size is just 14 arcseconds in the 16/01/2025 Opposition image. The Poliastro orbital plots show why: in 2025, Mars is nearly 50% further from Earth than when the Sun, Earth, and Mars aligned in 2020.In the 2025 image, the dark 'S'-shaped feature near Mars' southern limb - Terra Sirenum - appears higher on Mars' disk in 2020. Also the north polar hood is clearly visible in 2025. These differences result from Mars' 25° axial tilt. In 2020, the southern hemisphere was tilted toward Earth, while in 2025, the northern hemisphere is better presented, 'shifting' features like Terra Sirenum further south, as shown by the simulated globes for both orbital positions.
Venus
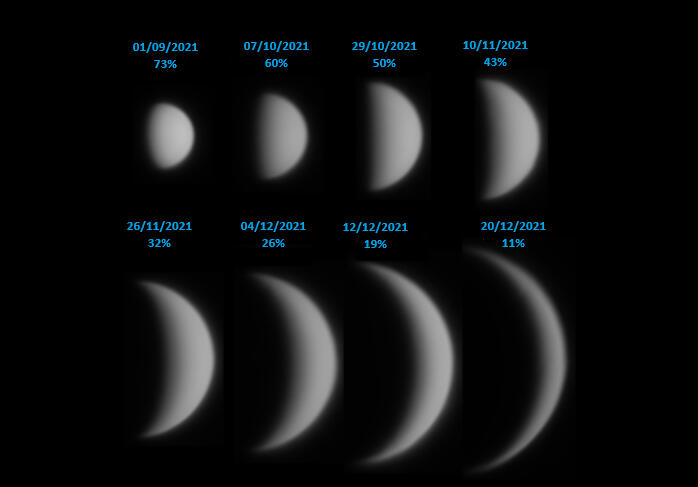
Venus' thick cloud cover prevents us from seeing its surface, and even variations in cloud texture are extremely subtle, so our imaging system records the planet as mostly white and featureless. But being an inferior planet, it goes through phases like the Moon —full, gibbous, crescent, and new. Unlike the Moon though, Venus appears largest when it's a thin crescent, subtending about 60 arcseconds, the greatest of any planet. This is right at the limit of naked eye resolution, so some people with excellent vision are able to make out the crescent without optical aid! Venus is actually brightest when it's a crescent - when it looks like the 04/12/2021 image, as this is when it presents the greatest amount of surface area in the sky. When Venus looks full to us, it's far from Earth, and so its disk appears relatively small.
Mercury
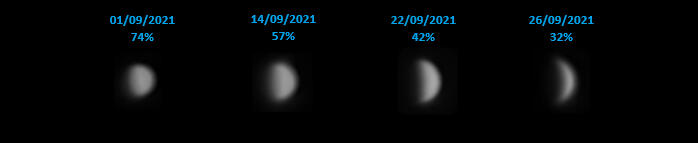
Mercury is a challenging planet to image. Firstly, it's small - typically between five and ten arcseconds.Secondly, it's never far from the Sun, which means when you image it after sunset, as I did with this sequence, you have a very short window of opportunity to capture it before the planet too sets, and it's still twilight when it does so. And imaging so close to the horizon also means the light is travelling through a very thick layer of atmosphere, so images suffer from dispersion and distortion.Thirdly, although Mercury presents the same phases to us as Venus (since it's the only other inferior planet), it goes through its cycle far more quickly than Venus - you can see from the sets of images for the two planets that what Venus exhibits in three months, Mercury does in three weeks. This means if you intend to assemble images of a full cycle of phase changes, you're a lot more sensitive to how many good imaging days you get with Mercury (days not affected by haze, cloud cover and so on).Whereas Venus shines brightest as a crescent, Mercury does so near full phase. And since Mercury is a small, rocky world without atmosphere, cratered by impacts and flooded by ancient lava flows, much like the Moon, it's theoretically possible to capture albedo features on its surface with our imaging system. But because of the aforementioned challenges, it's not easy.
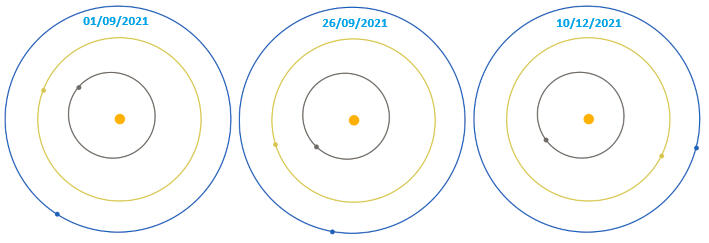
These diagrams show the positions of Earth (blue), Venus (yellow), and Mercury (grey) in their orbits on certain dates the planets were imaged. The planets rotate counter-clockwise on their axes, so in the diagrams if a planet is left of the Sun as seen from Earth, it sets after sunset, but if it's to its right, it rises before sunrise.01/09/2021: Both Venus and Mercury set after sunset, Mercury first. The angle between the Sun, the planets and Earth is similar, and the Sun is 'in front' of the planets from our perspective, so both planets present a similar gibbous phase. Both planets are also similarly distant from Earth at this point, so their comparative image sizes is representative of their actual relative size.26/09/2021: From Earth, the Sun is now 'behind' Mercury, creating a crescent phase as most of the planet is in shadow. Mercury appears larger since it's closer to Earth.10/12/2021: The Sun is 'further behind' Venus as viewed from Earth than it was behind Mercury on 26/09/2021, so Venus presents a thinner cresent. Venus sets earlier after sunset than three months ago, as the angular separation between the Sun and the planet from Earth is smaller. Venus is also a lot closer to Earth in its orbit than three months ago, so it's correspondingly much larger as well.
Uranus, Neptune

Neptune is technically the only planet too faint to see with the naked eye. But for all intents and purposes, so is Uranus. On paper, Uranus is right at the limit of naked eye visibility, but spotting it requires good eyesight, dark skies, the planet positioned reasonably high in the sky, and preferably near Opposition. Even then, you need to know exactly where to look. So as you'd expect, even for telescopic imaging, both planets present a very small apparent size - at their best, Uranus less than four arcseconds and Neptune less than three. Nevertheless, they resolve as disks, and they have distinct colours. Uranus is closer to cyan, and Neptune to azure. The lighter tone of Uranus is thought to be caused by an excess of aerosol haze in its atmosphere. Unlike say Jupiter, both of these gas giants display only subtle, low-contrast variations in their atmospheres, making it challenging to capture anything but a smooth, uniform texture across their disks.
Dwarf Planet
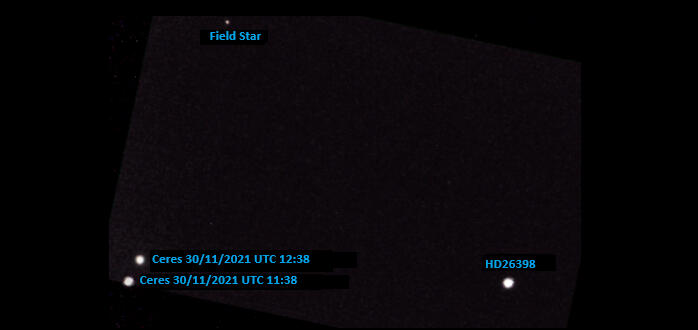
If our intent is to image all types of solar system objects (besides all the planets, that is), then a dwarf planet needs to be on the list. This is a body that has sufficient mass to assume a round shape, but hasn't cleared its orbit of other debris. Basically, if you look, smell and taste like a planet, but are in an asteroid belt, you can't be a planet.Back in the day when Pluto was considered a planet, we would have had no choice but to image it, and then we'd have our work really cut out for us. Even locating the specific region of sky Pluto's in is a challenge, and at fourteenth magnitude, it would likely be indistinguishable from a very faint star. But now that Pluto's a dwarf planet, thankfully we don't have to go after it because there's another dwarf planet about the size of Saturn's moon Dione in the asteroid belt between Mars and Jupiter - Ceres.Ceres is too small to resolve as a disk, but it shines between seventh and ninth magnitude, so is much easier to identify and image. Here I've imaged it one hour apart, enough to clearly see it in motion relative to the stars in the same field of view.
Asteroid
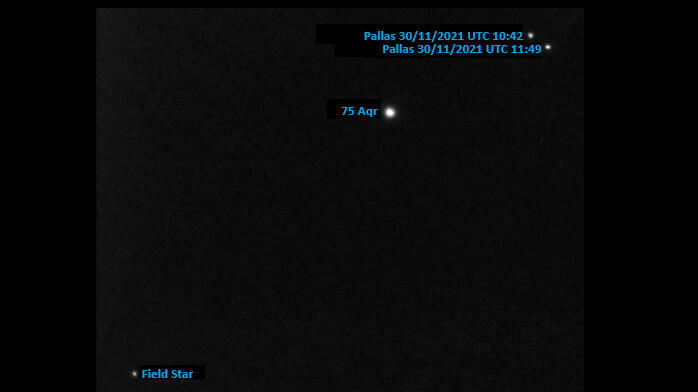
At about half the size of Ceres, Pallas is the joint second largest object (together with Vesta) in the asteroid belt between Mars and Jupiter. It's classed an asteroid and not a dwarf planet, because it's not quite round. Pallas' orbit is highly inclined and eccentric, similar to that of Pluto. As a result, Pallas' brightness can vary significantly depending on where it is in its orbit - from seventh to eleventh magnitude. Here I've imaged it nearly one hour apart, again sufficient to record its motion against the stars in the same field of view.
Comets
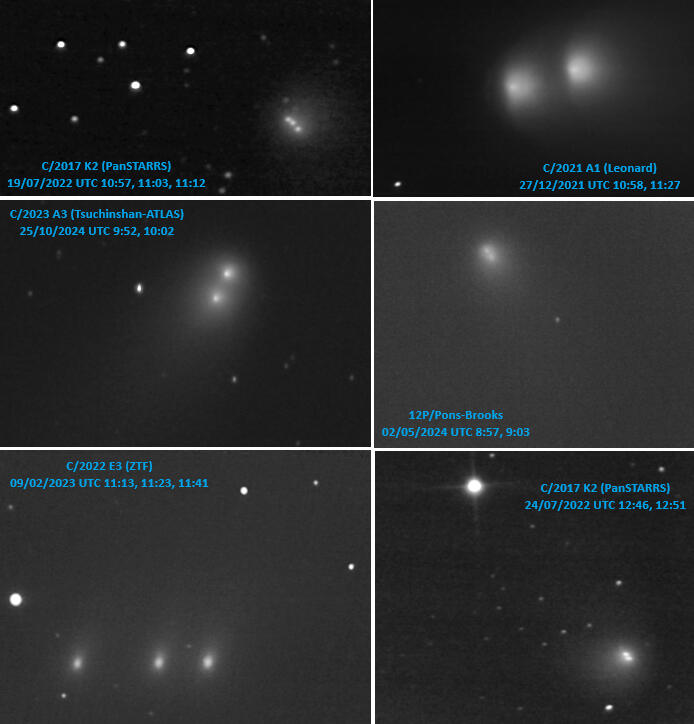
Asteroids and comets are both small objects that orbit the Sun, but asteroids are rocky or metallic, while comets are icy dirtballs. Asteroids don't normally form tails when they approach the Sun, but comets famously do as the Sun vaporizes their ice, releasing gas and dust, forming a coma and leaving a trail.The images we 'normally' see of comets are widefield, long exposure shots, often displaying the comets' tails curving across many degrees of the sky. Our imaging system however closes in on the structure of a comet's nucleus and coma around it, with a small part of the comet's tail captured as a diffuse, lower contrast, directional glow. These relatively close-up images show each comet's movement in relation to the stars, in just a few minutes. They also demonstrate the fact that you can't tell where a comet is heading based on where its tail points. Counter-intuitively, a comet's tail doesn't 'trail behind it', rather it points away from the Sun.Comets have widely varying orbital periods. As a comet with a 'short' period, 12P/Pons-Brooks will return 71 years after the images of it here were taken. All the others in this set are comets with periods in the tens of thousands of years, and because comets' orbits are continually updated as new data is gathered, it's possible that some may never return to the solar system. Actually, one of these 'long' period comets that we definitely know won't return is C/2021 A1 (Leonard) - it disintegrated within a year of the image. There's always a risk of that happening with both short and long period comets.
The Moon
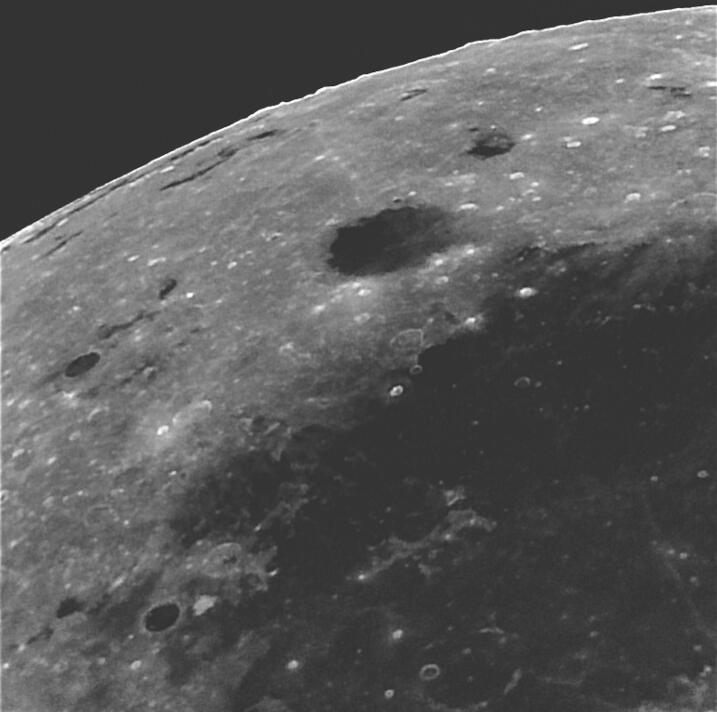
The Moon rotates at the same rate as it revolves around Earth, so keeping the same side facing us, but it also nods and tilts slightly, a motion called libration. This causes the visibility of features along the limb to shift, depending on the libration angle.This image at native focal length shows the Grimaldi quadrangle between Oceanus Procellarum (lower half dark region) and Mare Orientale, which appears as thin dark sliver on the limb, at near full Moon, during moderate western libration (5.5°). A larger portion of Mare Orientale becomes visible under even more favourable libration, and it's best seen during rare windows of coincident extreme western and southern librations, which occurred in September 2021, with the next opportunity in September 2027.The 'bumps' along the limb are mountains in the Orientale basin's rings. The leftmost peak is part of the Inner Rook ring, the next peak to its right is in the Outer Rook ring, and the two rightmost peaks are in the Cordillera ring, arguably the best preserved basin ring on the Moon. Again, these become more prominent under optimal libration conditions.
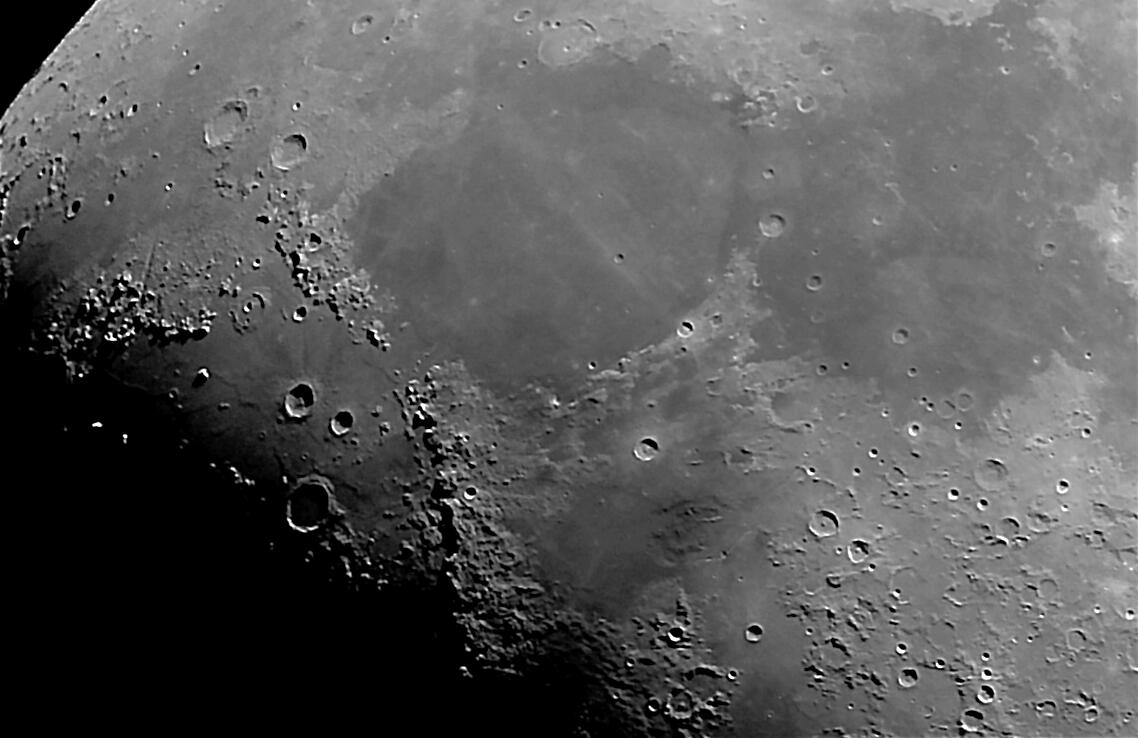
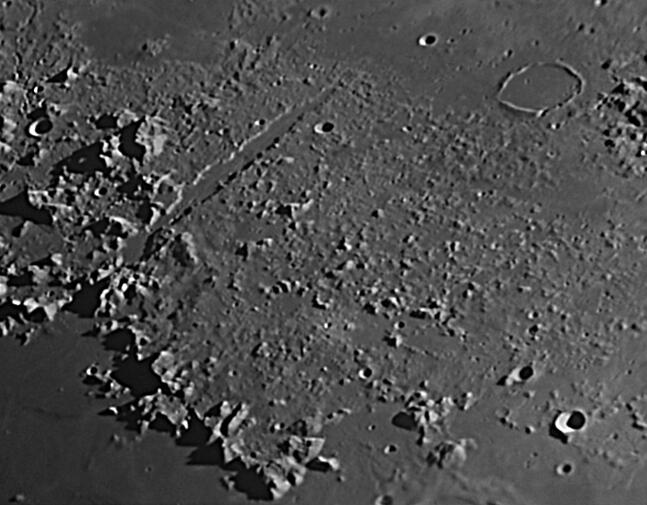
This image was captured with a 0.5x reducer. The Sun's rising over Mare Imbrium, the largest volcanic deposit to have flooded a lunar impact basin. It joins the roughly circular Mare Serenitatis to its right, at a 70 km gap between the Imbrium basin's Montes Apenninus and Montes Caucauses mountain ranges. The origin of the ray crossing Mare Serenitatis is uncertain - it's actually aligned with a ray from the crater Tycho, 2,000 km to the south! Adjacent to Mare Serenitatis lies the slightly larger Mare Tranquilitatis, probably the most famous of the lunar mares thanks to it being the recipient of the first ever human footprint on the lunar surface. The much smaller Mare Vaporum immediately to the south of Mare Serenitatis, is the closest mare to the centre of the lunar nearside.
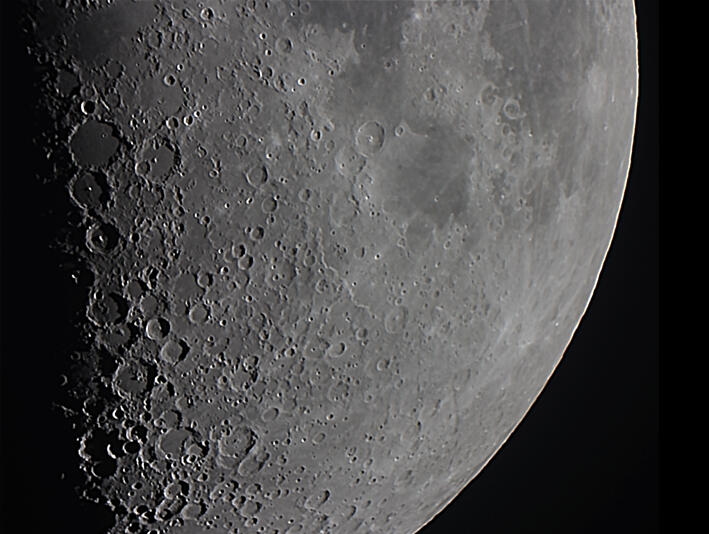
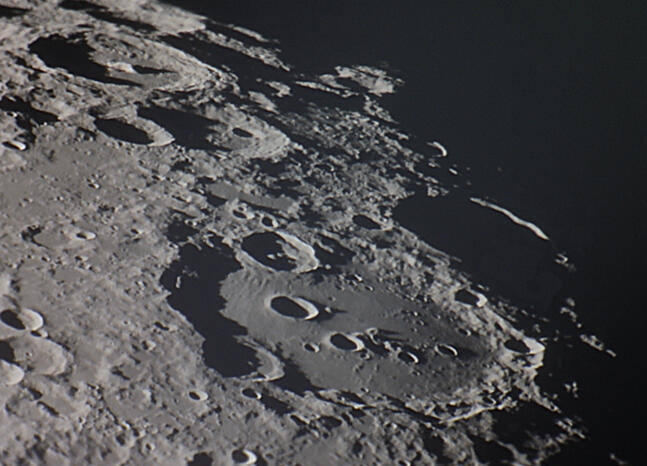
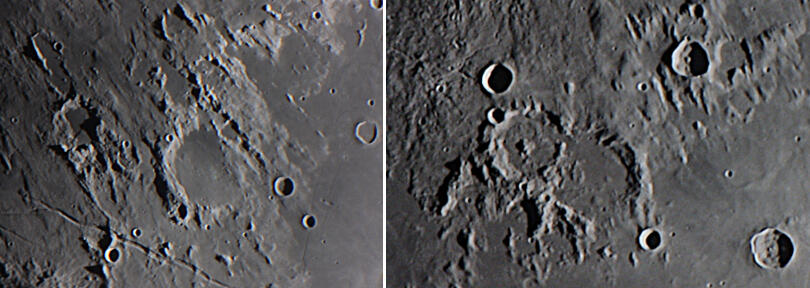
This is the south-east quadrant of the Moon at first-quarter phase, or 'half Moon', again with 0.5x reducer. The heavily cratered southern highlands contrast starkly with the smooth mares in the previous image. The Sun is just beginning to rise on ancient 230 km Deslandres, one of the largest craters on the lunar nearside. You can make out its faint outline in the lower left of the image. This crater is imaged in close-up further on.
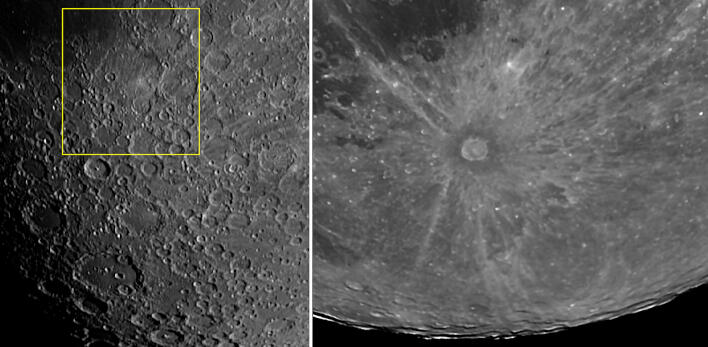
In the left panel, the terminator is further west than in the first-quarter image, showing Deslandres - highlighted - in a higher Sun. Tycho is on the bottom edge of the yellow rectangle, with Clavius and Moretus near the bottom edge of the image. Close-ups of these craters follow below.The same region is imaged close to full Moon in the right panel, demonstrating that the appearance of lunar topography changes dramatically with illumination. The largest bright spot near the top is 'Cassini's Bright Spot,' caused by the high reflectance of the ejecta blanket from the relatively fresh 4 km Hell Q crater on Deslandres' floor.Tycho, the consummate chameleon, blends into the heavily cratered field in the left panel, but in a higher Sun, turns into indisputably the greatest ray crater of all, with its famed bright, slender streaks arcing half way around the Moon's surface.The dark 'collar' around Tycho, thought to be impact melt, is asymmetrical, wider towards the south-east than the west. This suggests a westerly impact, supported by Tycho's ray pattern: An oblique impact creates a butterfly ejecta pattern with a 'forbidden zone' where rays are absent in the direction from where the projectile came. This is seen as a 120° arc of missing rays to the west of Tycho.
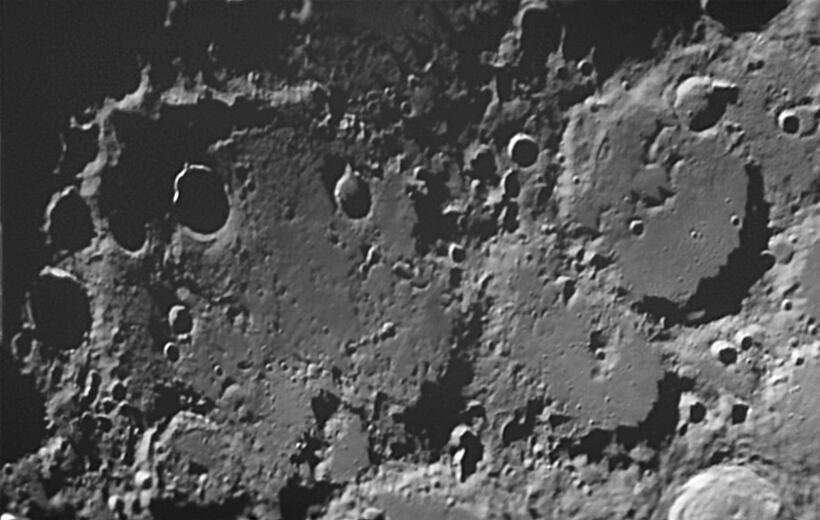
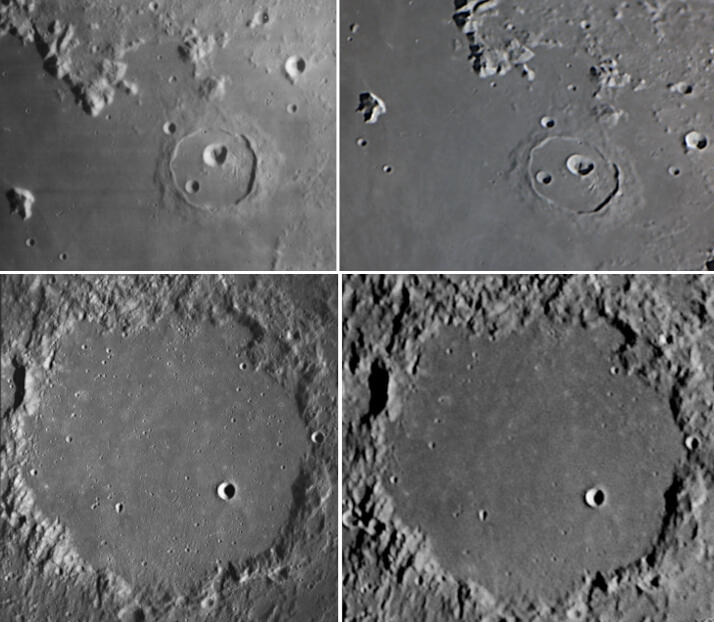
This 'close up', and all subsequent ones, are are done with a 3x Barlow lens. Also in what follows, some analyses and speculations on the identification and origin of certain features are attributable to planetary scientist Charles A. Wood.The somewhat 'squished' appearance here of one my all-time favourite craters - 225 km Clavius - is due to foreshortening, as it's located close to the Moon's southern limb. It's sometimes referred to as a ‘walled depression’ because the terrain surrounding its outer rim is as high as the rim itself. Two 50 km craters are part of the Clavius formation – Rutherford which is located entirely within the southern rim of Clavius, and the rather rude Porter which lies smack on top of the north-eastern rim. Porter looks more worn than the sharper Rutherford, so it's likely older. You can see a small craterlet lying against Porter's inner wall, so here we have three-deep nesting of craters - the craterlet within Porter and Porter (partly) within Clavius.The jewel in Clavius' crown though has got to be that distinctive arcing chain of craters of decreasing size, starting from Rutherford, neatly curving along Clavius’ floor. It really looks like there's some method behind the design, but it's likely random.The top left of the image features the far more recent 115 km 'complex' crater Moretus, with its sharp rim, terraced inner walls, and 2.7 km tall central peak.
Tycho is one of the few craters on the Moon visible with the naked eye, thanks to its extensive system of rays. In this close-up the freshness of the crater contrasts with the battered, degraded southern highlands in which it sits. The dinosaurs would have witnessed the impact, before they themselves got wiped out by an impactor a few tens of millions of years later that, according to one theory, came from the same collision of asteroids that sent a fragment Moon-ward to create Tycho.It's 5 km from the highest point on Tycho's rim crest to the crater floor, and the central peaks are 2.5 km from base to summit.
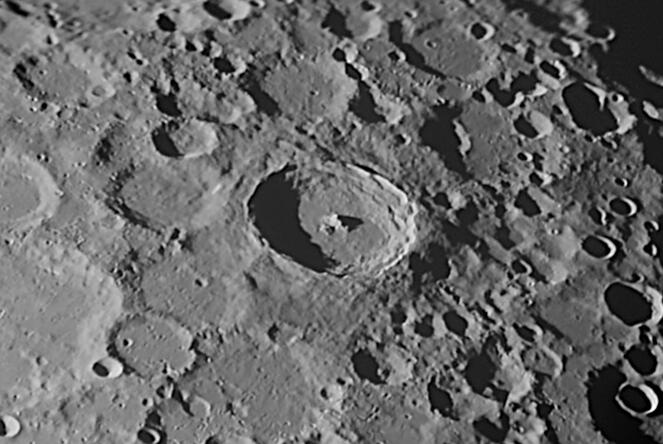
Deslandres only got classified as a crater in 1942. Prior to that it was sometimes referred to as Hell Plain, after the 33km crater Hell that resides in it. The reason Deslandres evaded identification for so long is that it's so highly eroded that it's very difficult to pick out, unless the Sun angle is really low, like here.Notice what looks like the outline of a 70 km inner ring within Deslandres. But if that's what it is, it's pretty unusual because you don't normally come across multi-ring basins less than about 300 km wide. Then there's the catena (crater chain) of five craterlets towards the eastern rim of the crater. If these are secondary impacts, it's not clear where they originated from as they don't point back to the Imbrium basin, or any other likely suspects.The crater adjoining Deslandres - to its east - is Regiomontanus, and what's particularly interesting about it is the presence of a 5.5 km crater on top of its central peak. Proponents of the volcanic origin of lunar craters once pointed to this 'vent' as proof the central peak was a volcanic structure. What are the chances, they reasoned, of a random projectile hitting a peak right on its summit? Turns out that's exactly what happened.
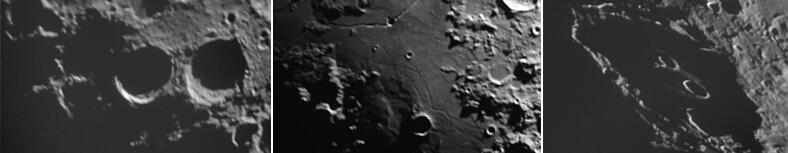
The nail file-like Vallis Alpes (Alpine Valley) bisects the Montes Alpes range, extending radially from Mare Imbrium almost to the neighbouring Mare Frigoris. One theory about its formation is that stresses from the Imbrium impact created two parallel fault lines, then the area between them fell below the surrounding landscape, and the resulting valley eventually partially filled with the lava that formed the Imbrium and Frigoris floors. In other words, it's a graben, but then, other lunar graben are not like this.You can just make out a sinous rille which runs down the middle of the valley for its entire length - this was probably a lava flow channel. Its width varies between only 550 and 800m and it's also less than 80m deep, making it a very low contrast feature. This image does demonstrate though that it's possible to resolve a narrower linear feature than a crater.
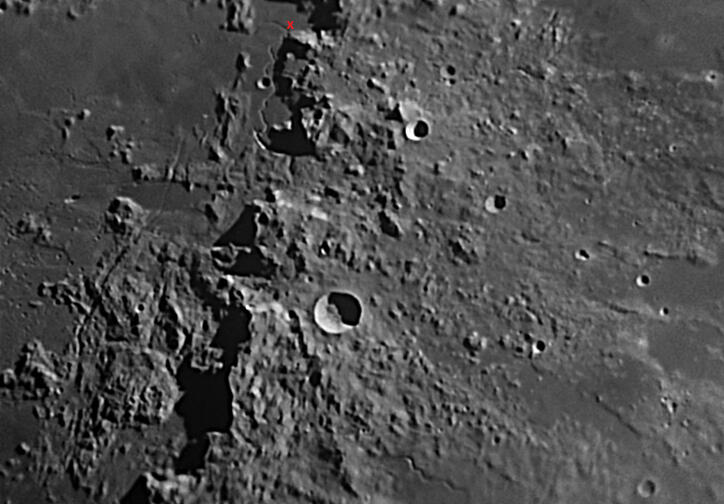
The red X at the top of this image marks where Apollo 15 landed - at the elbow of the Hadley rille, one of the Moon's longest and widest lava channels. It runs parallel to the Montes Apenninus range, the most impressive remnant of the Imbrium basin's rim. The striking appearance of this range and its easy visibility have led to the common, though incorrect, belief that it hosts the Moon's tallest mountains. The largest crater in the image is the 21 km Conon in the Apennines’ foothills, with the 4.9 km tall Mons Bradley just south-west of it. South-east of Conon, near the bottom edge of the image, the sinuous Rima Conon rille is visible. The smooth patch around it might be lava transported by the rille. The area east of the Apennines shows ejecta deposited during their uplift, altering or obliterating pre-existing features.Much of the Apennine peaks' height comes from fallback ejecta. The ridges west of the Hadley Rille are likely slump blocks, contributing to the jagged appearance of the range, which would otherwise be smoother like typical crater rims.The Imbrium impact also caused extensive faulting along concentric and radial lines. The prominent concentric fault, Rima Bradley, is a graben running parallel to the Apennine front. It cuts through both highlands and a dark mare pond, typical of lunar graben. Radially, the Apennines are sliced into slabs by forces that carved the crust along parallel faults.
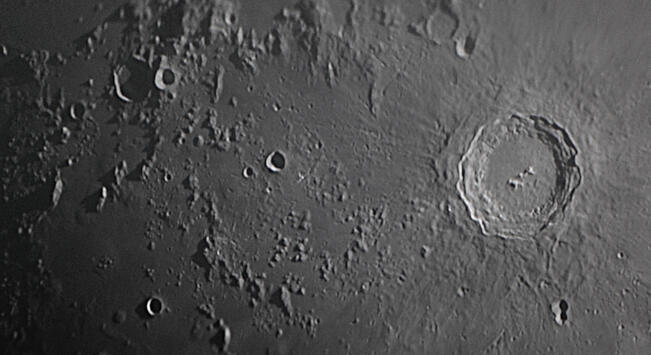
The right half of this image is dominated by the magnificent, well preserved, polygonal 90 km 'monarch of the Moon': Copernicus. The crater floor to the right of its central peaks looks rugged, but is smoother on the left. This could be from impact melt – it may not have cooled equally across the floor, resulting in rough and smooth regions. To the south of Copernicus is the distinctive keyhole-like double crater Fauth and Fauth A. This pair is radial to Copernicus and is likely one of its secondary impacts. An equal distance to the south-east of Copernicus lies the 4 km 'dark halo' crater Copernicus H. It's younger than Copernicus, and the dark patch around it is probably from the Copernicus H impact excavating darker material from beneath the mix of highland and mare material in the region, and depositing it around the crater.The lower left of the image captures the Milichius/T. Mayer domes area. Lunar domes are a good example of a very low relief feature best seen in grazing illumination. The majority of these are low, wide hemispherical structures with diameters between 5 km and 15 km, heights in the few hundreds of metres and slopes up to 5°. It's not uncommon for them to occur in clusters or groups, as here.Part of Montes Carpatus can be seen along the top edge of the image, and the smooth surface around all the ejecta hills in the centre of the image is lava flows from Mare Insularum, which also created the domes.
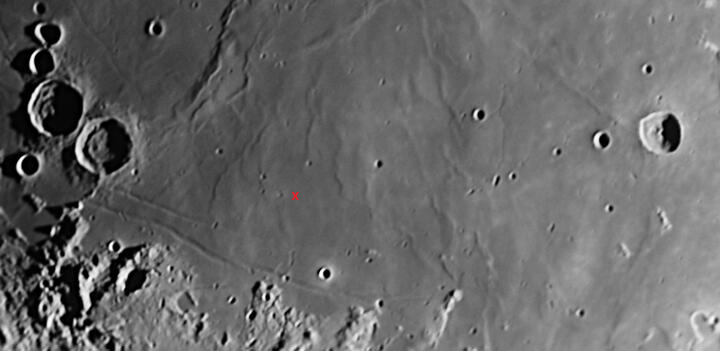
Wrinkle ridges are yet another example of low relief features best seen when the terminator is nearby. There's many across the southern part of Mare Tranquilitatis here. They could be the outlines of basin remnants submerged under the mare lava, or the result of lava built up around tension cracks and fractures, or ridges arising from the tilting of the mare from the load of the lava fill, or a combination of any or all of these.It's common for wrinkle ridges and graben - like Rimae Hypatia in the lower left corner of the image - to appear together in lava-flooded regions. It can be that as the crust sags under the lava load, the rocks in the centre are compressed, forming wrinkle ridges, while the rocks at the edges are stretched apart, creating graben. Near the centre of the lower rille of Rimae Hypatia, there's a visible offset, which may have been caused by a fault that shifted the eastern half of the rille northward.The red X marks where Apollo 11 landed. Many of the features in this image were given nicknames by the astronauts, and the row of three craters to the north of the base were officially named after them.
The left panel shows the similar, adjacent craters Sabine and Ritter in a higher Sun, and reveals them to be relatively shallow with no wall terraces or central peaks. Initially thought to be volcanic calderas, their upturned rims confirm they are impact craters, though modified by volcanism - their uplifted floors likely caused by magma rising beneath the basin edge. Could the impacts be related? Perhaps, if the projectile split before striking or if it was a binary asteroid. However, Ritter’s sharper rim suggests it might be younger. So Ritter could possibly be a completely unrelated impact occurring after Sabine.The right panel shows the mare region north of Sabine and Ritter, with yellow markers highlighting the dome Arago Beta. Unlike the typical hemispherical 'blisters' in the Milichius/T. Mayer region, Arago Beta is larger, steeper, rougher, and more irregular. Perhaps it formed during a later volcanic stage than the one that filled the mare, with lava oozing to the surface through multiple fractures, accounting for the irregular shape of the dome. Its size and texture could be down to the rate of flow, temperature and composition of lava in this region. Orange markers indicate another possible dome. It has a lower relief than Arago Beta, so is harder to pick out, but its shape and diameter are similar to that of Arago Beta. This further suggests some common regional factor at play in their formation.
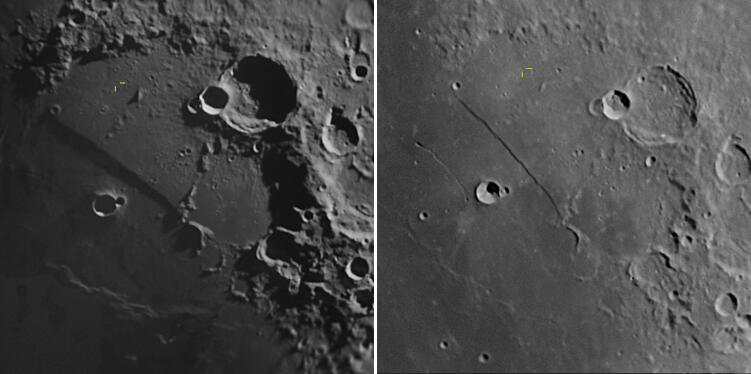
Rupes Recta, or the 'Straight Wall', is a 110 km-long fault on the Moon's surface, 300 to 450m high and 1 to 3 km wide. The images show it under grazing light and a higher Sun.The fault lies within the large crater 'Ancient Thebit'. The eastern rim is well-defined, while the western rim is subtler, marked by wrinkle ridges. The crater appears tilted, likely due to lava flooding that submerged the western rim or caused it to shear off, forming Rupes Recta. The shadow slant suggests the northern section of the fault is higher.When combined with the Stag's Horn mountains at its southern end, the structure resembles a fencing foil, known as 'Huygens Sword'. West of Rupes Recta is Rima Birt, a 50 km sinuous rille with pits at both ends, unusual since rilles typically have a vent at only one end as the source of the rille.To the east of Rupes Recta on the rim of Ancient Thebit is the 55 km crater Thebit with a shallow, uplifted floor. Across Thebit lies the smaller Thebit A, and across Thebit A's rim rests the even smaller Thebit L. This arrangement follows the rule that the crater on top is always younger, and usually smaller.The yellow markers in the images indicate a 2 km crater for scale.
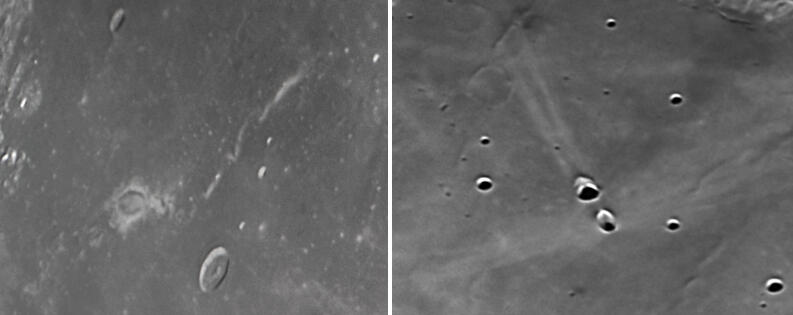
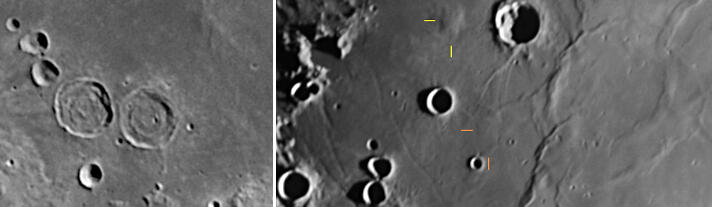
Here we have two of the Moon's most unusual features.The left panel shows Reiner Gamma, a tadpole-shaped feature with a bright elliptical halo around a 30x20 km core, and a 160 km long tail. It lacks shadowing, so it's neither a crater nor elevated. The pattern is thought to result from magnetized crust or ejecta deflecting solar wind, with the area the wind is deflected from not darkening, and the regions the solar wind is deflected to, darkening more than usual. The origin of the magnetic field and the swirl's shape remain unclear.The right panel features the Messier and Messier A craters in Mare Fecunditatis, each 11-13 km wide. Messier is markedly oval, and Messier A overlaps another crater. Their perpendicular ejecta rays resemble wings and a comet tail. This formation has led to bizarre theories about its origin, like a meteorite tunneling right through the Moon. Lab experiments however suggest Messier formed from a low-angle impact (<5°), and Messier A from a steeper one (10-15°). The craters' proximity and ejecta patterns imply they're related, so two possible scenarios for their creation might be:
Messier A 'impact one' was pre-existing, with a grazing impact forming Messier and its butterfly-rays. A fragment from this impact then created Messier A 'impact two' and its comet-rays.
All three craters formed simultaneously from a projectile that split into three, creating Messier, Messier A 'impact one', and Messier A 'impact two' with their associated rays.
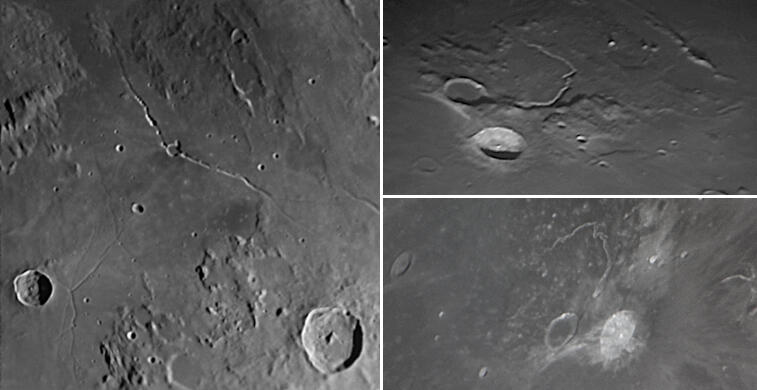
The left panel highlights a couple of rille systems in the visible centre of the Moon: the 'clock hands' of Rima Hyginus (above centre) and the 'railway switchyard' of Rimae Triesnecker (bottom left). The northern arm of Hyginus and some Triesnecker rilles are radial to the Imbrium basin, suggesting that Imbrium impact stresses influenced their formation. Hyginus crater (9 km) lacks an upturned rim, indicating a volcanic origin. The Hyginus rille may have formed as a volcanic graben, with magma causing faulting, creating a rift and triggering an eruption, leaving dark patches around the rille. The linked craterlets along the rille's northern arm could be collapse pits.The Triesnecker rilles are puzzling. They don't resemble typical sinuous rilles or graben, lack volcanic features, and extend in multiple directions, possibly indicating varying ages.The right panel focuses on the Aristarchus plateau, one of the most geologically diverse regions on the Moon. Next to 40 km Aristarchus, the brightest crater on the Moon, is the far older, lava-flooded Herodotus. Between them lies Vallis Schroteri (Schroter's Valley), the Moon's widest and deepest sinuous rille. The plateau is covered in the Moon's largest known pyroclastic deposit (material from explosive eruptions), and surrounding the plateau there's mare material of different ages, ejecta blankets and ray deposits, vents and mountain ranges. With such a smorgasbord of features, no wonder Apollo 18 was planning to land here and check it out.
Imbrium ejecta spreads across vast distances, reshaping pre-existing lunar features, and creating rimmed grooves, craters, and lineations known as the 'Imbrium Sculpture'. It's most concentrated south-east of the basin, indicating an impact from the north-west.In the left panel, the region east of the Hyginus rille shows how the Imbrium Sculpture has 'refashioned' craters like Julius Caesar in the centre of the image, and Boscovich to its west, with features of the sculpture pointing toward the Imbrium basin 500 km away. Many of the larger craters are flooded with mare lava post-impact. Rima Ariadaeus, crossing the lower left, cuts through the Imbrium Sculpture, suggesting it’s younger. The offset in the rille near the image’s bottom could be due to a fault, or a graben-forming sub-surface magma column dying out, and another continuing in the same direction.In the right panel, Imbrium ejecta again heavily affects the terrain north-west of the Triesnecker rilles, from the pebble-like hills in the upper left to the pasty splatter, grooves and lineaments in the upper right. Ejecta coats the rims and floors of the joined craters Pallas and Murchison in the lower middle of the image, with four clefts in Pallas’ northern wall likely caused by projectiles from the Imbrium blast. A missing half-crater near their southern rims may have tilted and filled with mare lava. North of Pallas is shadowed Bode, with one of the rilles of Rimae Bode to its west, unusual for being located in a rubbly region rather than a mare.
Clair-obscur effects (literally clear and dark) are where the play of light and shadow on terrain creates a 'picture' of something that's not really there. In the left panel, an 'X' appears about a quarter of the way up the terminator from the Moon's southern limb before the first quarter phase, formed by sunlight striking the rims of Blanchinus, La Caile, and Purbach craters. This is called the Purbach Cross or Werner X, after the nearby Werner crater.In the centre panel, the 'Lunar V' forms about halfway along the terminator, created by the tops of Ukert crater and nearby ridges. The V is a bit larger than the X, and while both can appear together, the V lasts longer. Though these features occur every month, imaging opportunities are rare. They may only be visible before the Moon rises or after it sets, or during the daytime or when the Moon is too close to the horizon—conditions not optimal for imaging. As a result, there may only be two or three 'Goldilocks' nights a year, and even then, the weather needs to be on your side.In the right panel, the 'Eyes of Clavius' are the C and D craterlets within Clavius catching first light. Several features on Clavius' rim (including Porter crater) have merged with the dark interior to form the 'face'.
Photos from spacecraft (left column) vs backyard (right column).The top left photo of crater Cassini and surrounds in Mare Imbrium is 'Frame 4110 h2' taken by Lunar Orbiter IV in 1967, 2916 km above the lunar surface. The bottom left photo of ancient, polygonal, lava-flooded crater Ptolemaeus is 'AS16-M-1673', taken by Apollo 16 mapping camera in 1972, 116 km above the lunar surface.Although the resolution of the orbital photos is in the hundreds of metres and the smallest visible crater in the comparative Dob images is just under 2 km, the latter still hold up well when you consider the distance they were taken from, and the fact they had to contend with Earth's atmosphere.
Imaging Technique
A Dobsonian is a Newtonian telescope on a sturdy, boxy (usually timber) mount that lets you manually move the telescope up and down and side to side. A Newtonian telescope is a hollow tube (or an open truss structure) with a concave primary mirror at one end, and a flat diagonal at a 45° angle at the other end that reflects the gathered light into a focuser, where different eyepieces can be inserted.The Dobsonian design revolutionized backyard visual astronomy. However, since it lacks motorized tracking, it isn't suitable for traditional astrophotography, which relies on taking long exposures (many minutes at a time is not uncommon). Nevertheless, you can image with a manual Dobsonian using a technique you might call 'video drift imaging', which I used for all the images on this site. It involves positioning the object at the edge of the field of view (FOV), recording a video as it drifts across the FOV, pausing to manually nudge the telescope, and resuming the video as the object drifts across again. The key difference between planetary and deep-sky imaging is in the accessories used, the number of videos captured, and the processing method.
Setup
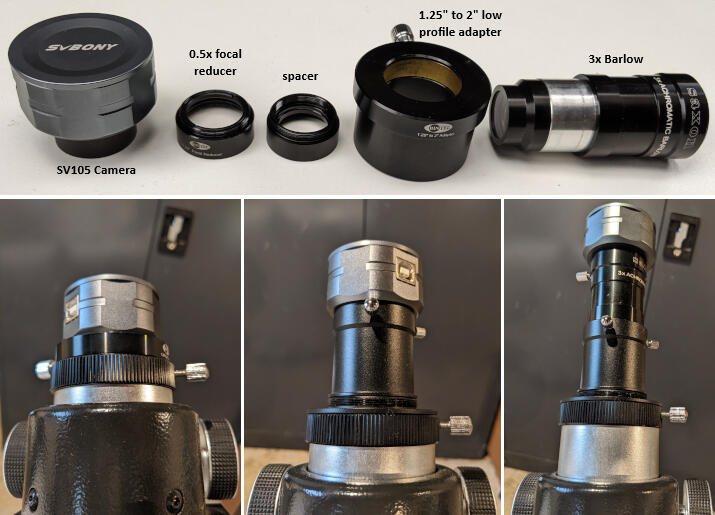
I use a Saxon 8" Dobsonian (which is really a rebadged Skywatcher with 203mm aperture, 1200mm focal length), with some accessories to enable imaging in three configurations:
Native Focal Length: Camera is inserted directly into the focuser adapter, per middle panel of photo. Suitable for capturing the brightest nebulae (e.g., Orion, Carina), some planetary nebulae, star clusters, and the Moon.
3x Focal Length: Camera is attached to a 3x Barlow lens, which is inserted into the focuser adapter, per right panel of photo. This configuration increases the image scale for small, bright targets like the planets, and nebulae like the Homunculus. It's also used for 'splitting' binary stars, and for 'close ups' of the Moon.
0.5x Focal Length: Camera is attached to a spacer, and the spacer to a 0.5x focal reducer. The stock focuser adapter is swapped out for a low-profile one, and the camera-spacer-reducer assembly inserted into it, per left panel of photo. This expands the FOV and increases brightness, necessary for dimmer objects like galaxies, most nebulae and comets, for some star clusters (so they fully fit in the image), and for wide Moon shots. The spacer ensures the correct distance between the reducer and camera, and the low profile adapter is to allow focus to be achieved due to the inward shift of the focal plane.
Acquisition
The camera simply plugs into a USB port on the laptop, and I use Sharpcap (free version) for all video capture.
Processing
All the processing software I use is also either free or open source.Planets: Usually, three video passes suffice. I use PIPP to eliminate the drift and centre the planet in each frame, then stack the best 10% of frames in Autostakkert! and sharpen the resulting image in Registax. This is also known as 'lucky imaging', as the goal is to stack only those frames that capture the clearest moments of 'seeing' through the atmosphere.Deep-Sky Objects: I set the exposure per frame to a maximum of 500ms to prevent star trailing. To capture as much light as possible, I stack around 90% of frames from each video (of three passes) in Autostakkert! As a result, each stacked image represents tens of seconds of exposure time. I typically take 10-20 videos per object, so generating that many individual stacked images. To combine them, I open the images in GIMP, align them, adjust their transparency inversely based on their sequence number (100% for the first image, 50% for the second, 33.3% for third and so on), and merge them. This process creates a final image representing up to five minutes of exposure. I then stretch the image with curves, and adjust contrast and levels.Note: The more videos of a dim deep-sky object you capture, the more images you can combine, and the more you improve the signal-to-noise ratio. However, the relationship between the number of images and the reduction in noise and enhancement of detail isn't linear. As you add more images, the benefit of each additional one diminishes. In practice, it's a case of doubling the number of images for a noticeable improvement in quality. I chose 'up to five minutes equivalent exposure' for the deep-sky images on this site as for me, that makes for a reasonable compromise between the result and the time and effort spent on capture and processing. But there are no hard and fasts about this - where you draw the line is of course, entirely up to you.